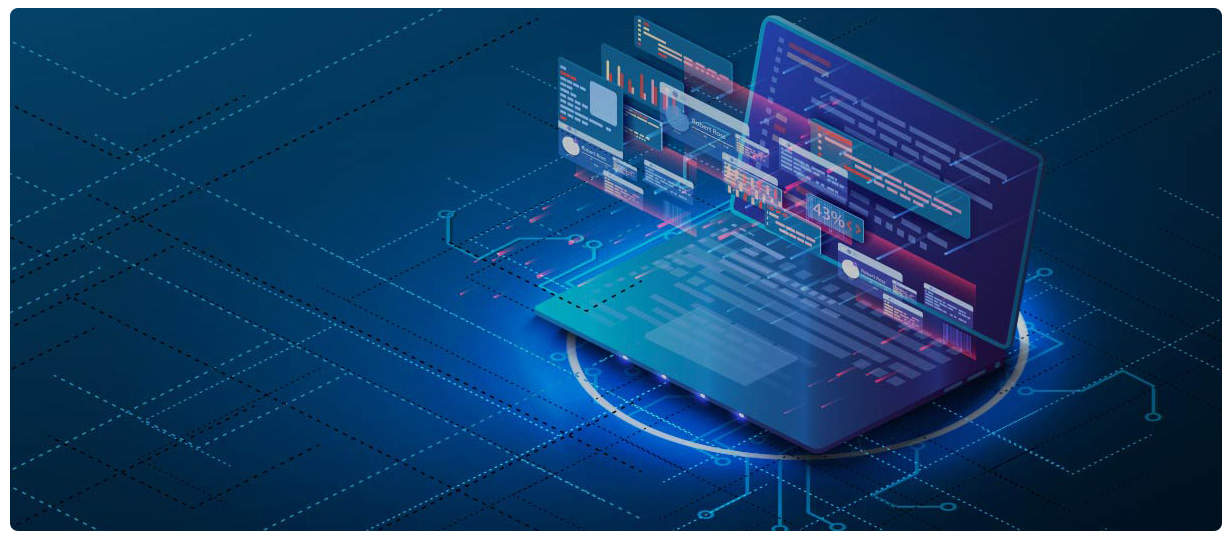
Deliver Resilient Applications Using New Age Performance Engineering
RECOGNITION
CAVISSON, ONE OF THE 5 BEST SOFTWARE COMPANIES OF THE YEAR 2020
Cavisson is committed towards technological advancements and innovations around customer experience and performance initiatives, as well as business parameters that directly impact revenue and operating costs.
CAVISSON RECOGNIZED AS ONE OF THE 30 MOST INFLUENTIAL COMPANIES OF THE YEAR 2020
Cavisson’s performance testing, monitoring, and diagnostics software, helps enterprises maximize up-time and optimize server response time for seamless transactions and exceptional buying experiences.


Introducing Free Toolbox for DevOps & SRE
Take advantage of calculating the downtime allowance, estimating the number of concurrent virtual users, and retrieving the IPv4 and IPv6 subnet information like host range, broadcast address, mask, notation, and many more to speed up the performance analysis with Cavisson’s free Toolbox.
Product Updates
Support of gRPC Protocol
Easy to create non-SSL/SSL gRPC calls with the server using gRPC protocol. And, use gRPC APIs in any script of NetStorm smoothly.


Analyze the Performance Characteristics of Web Application
Inspect and optimize the performance of your scripts using the Mark & Measure capability by improving the parts of the script that are consuming time.
Virtualize Socket Services using NetOcean
Virtualize socket services using new Socket Service Recorder and easily modify the virtualized request and response using NetOcean.


Introducing Advanced Forwarder Settings
While forwarding a service from NetOcean to the real end point, you can now perform more configurations like adding custom headers, connection timeout or ratio of requests to be forwarded. Configuration can be applied at all the levels according to feasibility.
NetHavoc Scenario
Now map different NetHavoc scenario phases like Ramp Up, Stability, and Ramp Down with NetStorm scenario phases. This is available in two modes:
- Normal: Both NetHavoc and NetStorm scenarios will be available in the same environment.
- Advance: Use Rest calls to get all NetHavoc scenarios from other environments.

Deep Dive Visibility into Kubernetes Nerve Center
Monitor the Control Plane, which is the nerve center of your Kubernetes cluster, and diagnose the orchestration issues occurring in your cluster. With Kubernetes Control Plane monitor, obtain 360 degree visibility of all the components of the Control Plane.
Being the nerve center of the Kubernetes cluster, Control Plane makes sure that the cluster works the way it is configured.
MongoDBServerStats
With a new plug-in monitor of MongoDB, you can monitor various stats, such as global lock time, current and available connections, and others.