Functional, Performance & Chaos — All in One Platform
Every engineering team has been there. You have a test script — maybe a Selenium flow, a JMeter plan, or a Postman collection — that validated a critical user journey. It passed. You shipped. Then production fell over under load, or a single node failure cascaded into a 3-hour outage. Sound familiar?
The root cause isn’t bad tests. It’s incomplete coverage across the application lifecycle. Most teams test in silos: QA owns functional, a performance team runs load tests on a Friday, and chaos engineering is something you “plan to do someday.” The result? Coverage gaps between each stage that only reveal themselves in production — at the worst possible time.
At Cavisson, we built our platform around a single belief: your test script should be the seed of full lifecycle validation — not just a checkbox for one phase. With Performance Testing Tool and Chaos Engineering Tool working as a unified engine, that belief is now a reality.
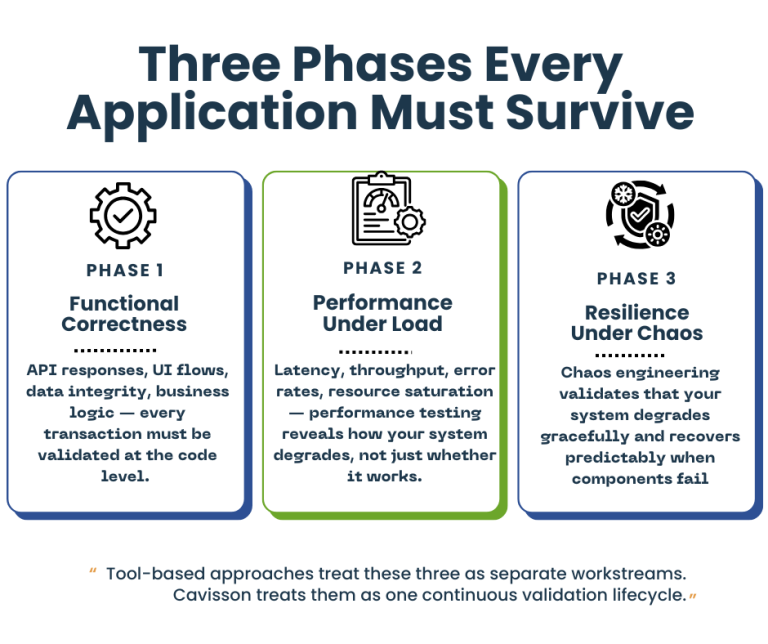
The Three Phases Every Application Must Survive
Before we talk platform, let’s frame the problem precisely. Modern applications must be validated across three distinct — but deeply connected — dimensions:
1. Functional Correctness
Does the application do what it’s supposed to? API responses, UI flows, data integrity, business logic — every transaction must be validated at the code level. This is table stakes, but it’s only the beginning.
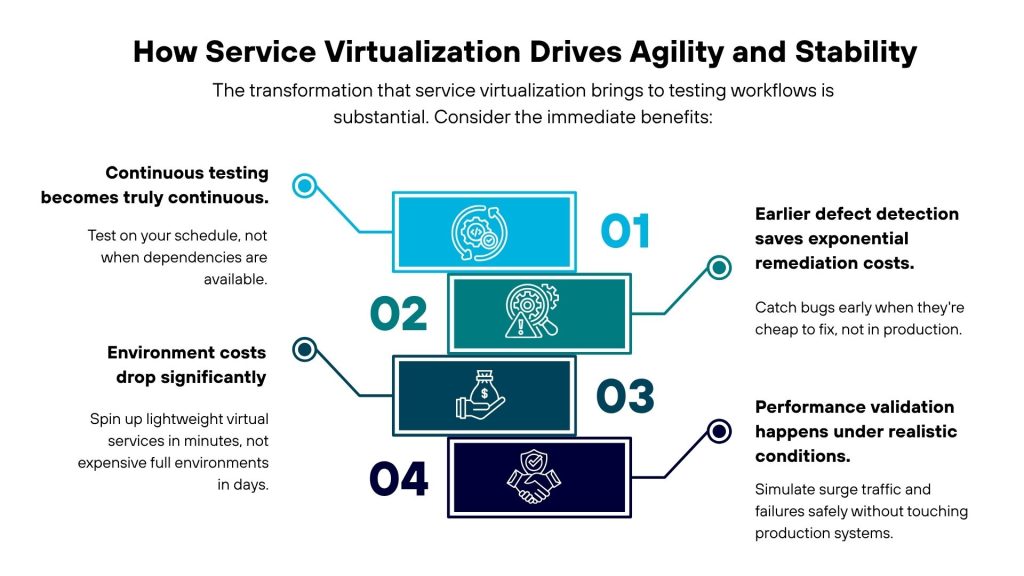
2. Performance Under Load
Does it stay correct and responsive when 10,000 users hit it simultaneously? Latency, throughput, error rates, resource saturation — performance testing reveals how your system degrades, not just whether it works.
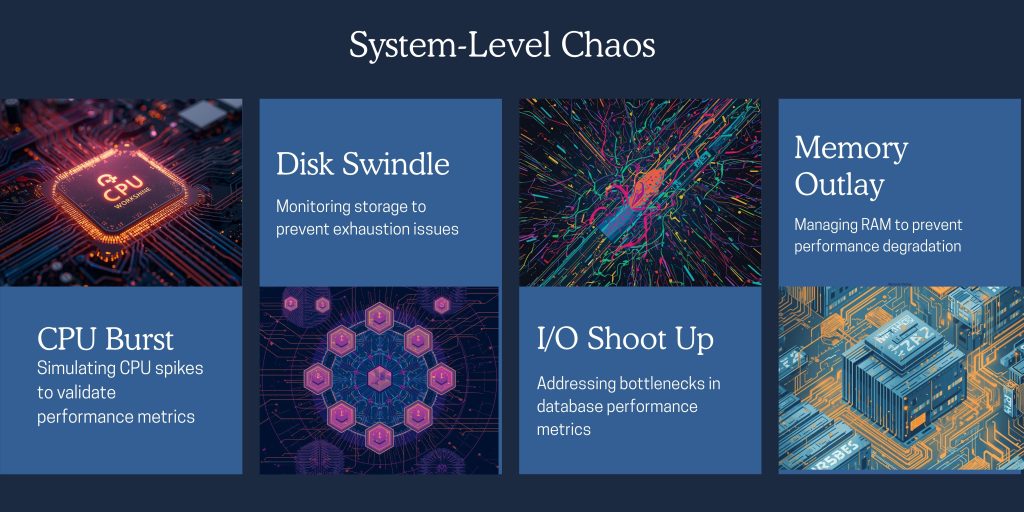
3. Resilience Under Chaos
Does it survive when infrastructure fails? Pod crashes, network partitions, disk I/O spikes, cloud region outages — chaos engineering validates that your system degrades gracefully and recovers predictably when components fail.
Tool-based approaches treat these three as separate workstreams. Cavisson treats them as one continuous validation lifecycle.
Why Tool-Based Testing Is Failing Your Team
The market is full of specialized tools. You likely have several already:
- A load testing tool (JMeter, k6, Gatling)
- A chaos engineering tool (Chaos Monkey, LitmusChaos, Gremlin)
- A functional testing framework (Selenium, Cypress, Postman)
- An APM solution for observability
- Possibly a dedicated contract testing tool on top
Each tool does one thing well. But the integration cost is enormous. Your teams maintain separate CI/CD pipelines for each. Results live in different dashboards. Correlating a latency regression with an infrastructure event requires manual sleuthing across five tools. And when something goes wrong in production, the post-mortem devolves into finger-pointing between teams using incompatible data.
The fragmentation isn’t a technology problem — it’s an architectural one. And it’s one that Cavisson was purpose-built to solve.
Functional Testing: The Foundation of Lifecycle Validation
Before testing performance or resilience, the system must first prove that it works correctly.
Functional testing forms the foundation of application validation.
It ensures that business workflows execute as expected before systems are subjected to scale or failure conditions.
Functional validation typically includes:
- UI workflow verification
- API response validation
- Business logic testing
- Integration testing between services
- Data validation
Functional testing answers the fundamental question:
“Does the transaction work?”
However, the limitation of traditional functional testing is that it often exists in isolation. Functional scripts validate correctness but are rarely reused for performance or resilience testing. This leads to duplicated work across testing teams.
At Cavisson, functional tests become the starting point of a unified validation lifecycle. A script created to validate a business transaction can evolve seamlessly into performance and chaos experiments.
Performance Testing Tool: Where Functional Meets Performance
Cavisson’s Performance Testing Tool is enterprise-grade performance testing engine — but calling it just a “load testing tool” fundamentally undersells what it does.
At its core, the Performance Testing Tool allows teams to author test scripts once and execute them across functional and performance scenarios without rewriting logic. A script that validates a checkout API’s response codes also becomes the load test that fires 50,000 concurrent transactions. The same business logic. The same assertions. Different scale.
Key Performance Testing Tool Capabilities
- Protocol-native support across HTTP/S, WebSockets, gRPC, JDBC, MQTT, and 30+ enterprise protocols — no protocol is an afterthought
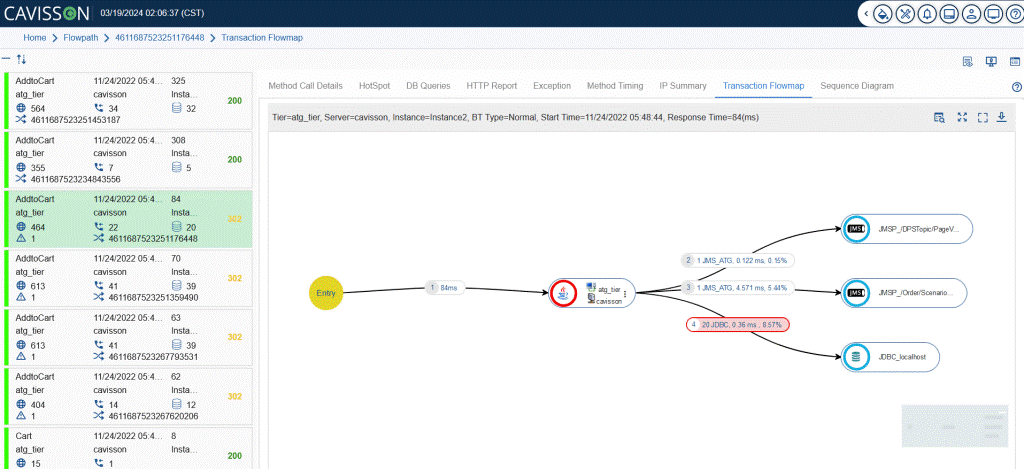
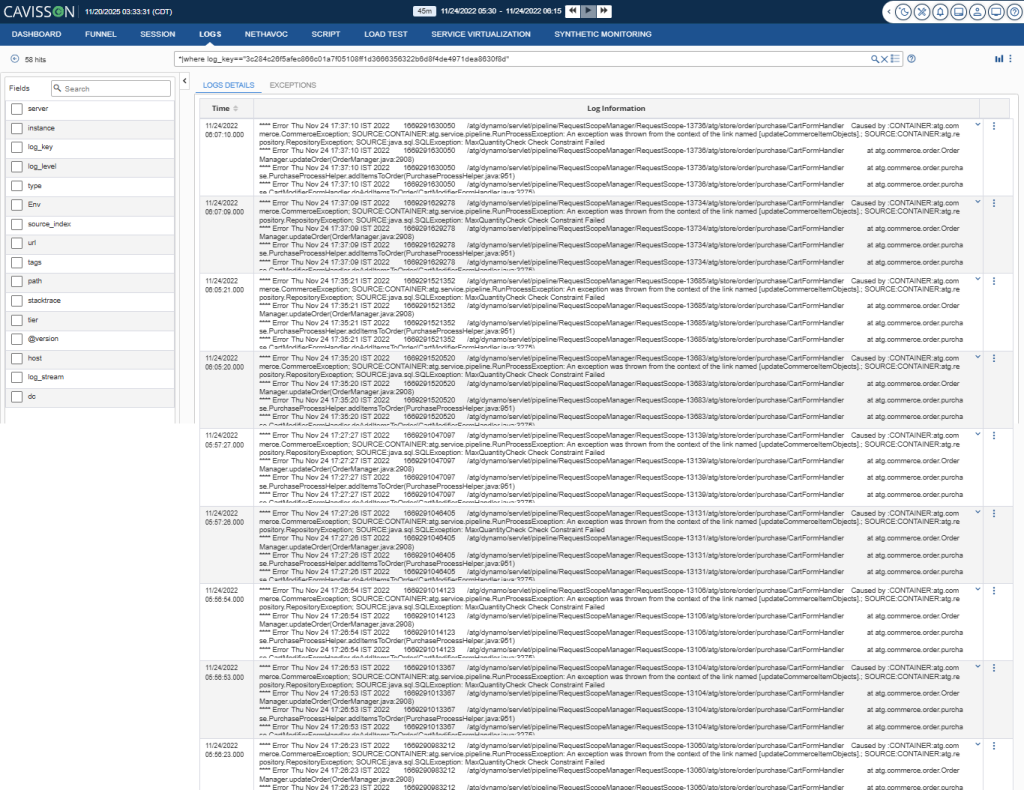
- Real-time transaction tracing with deep-dive diagnostics correlating response time to backend component latency
- Intelligent workload modeling with think times, pacing, ramp-up curves, and user behavior simulation
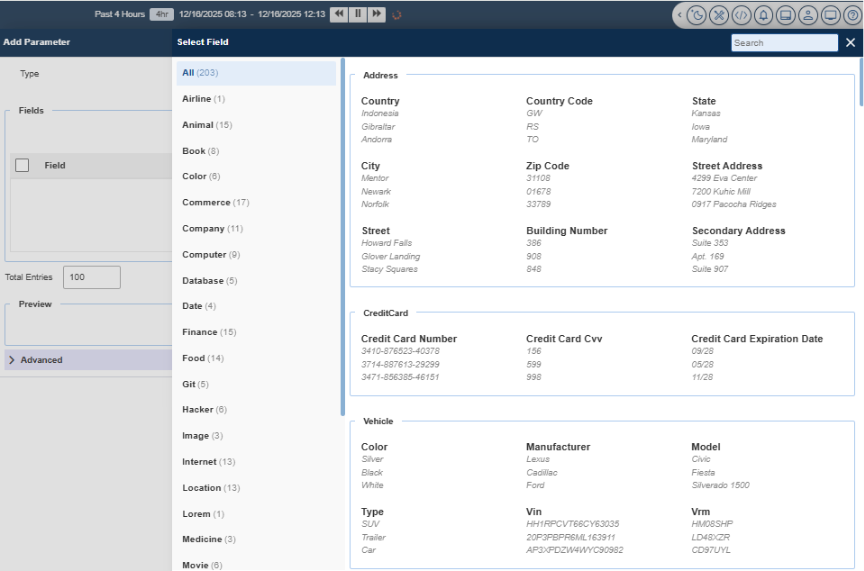
- Built-in functional validation: assertion libraries, response extraction, parameterization, and data-driven testing
- Distributed execution at cloud scale — millions of virtual users across geo-distributed nodes without proprietary agent overhead
- CI/CD native: plug directly into Jenkins, GitLab, GitHub Actions, or Azure DevOps for shift-left performance testing
The result: your QA team’s functional scripts don’t get thrown over a wall to a performance team. They evolve — on the same platform — into load tests, stress tests, soak tests, and spike tests. One codebase. One results repository. One team that understands the whole picture.
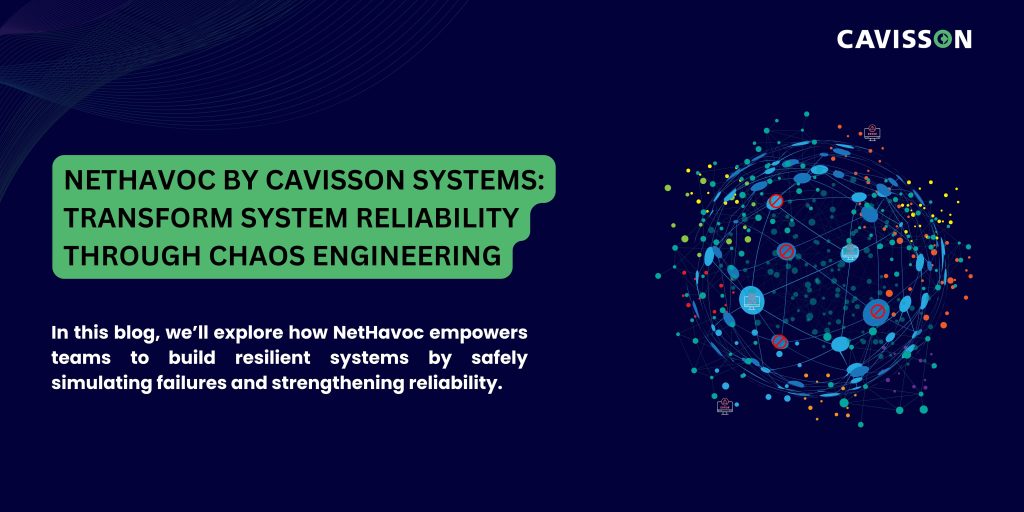
Chaos Engineering Tool: Engineering Resilience, Not Just Testing It
If Performance Testing Tool answers “does it perform?”, Chaos Engineering Tool answers “does it survive?”
Chaos Engineering Tool is Cavisson’s chaos engineering module, designed to inject controlled, measurable failure conditions into your systems — and validate that applications degrade gracefully, recover automatically, and meet your SLOs even under adverse conditions.
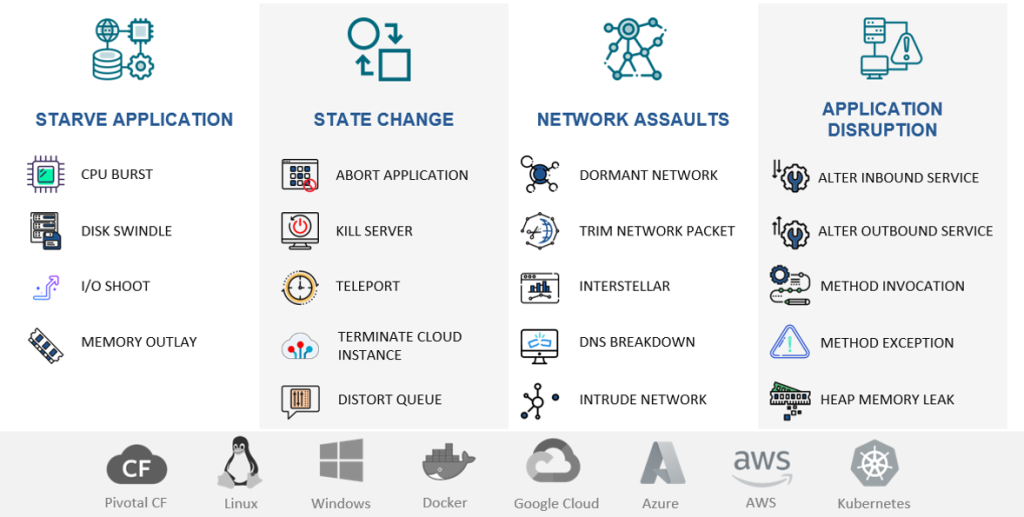
What Chaos Engineering Tool Brings to the Table
- Infrastructure-layer chaos: CPU throttling, memory pressure, disk I/O saturation, network latency injection, packet loss, and bandwidth constraints
- Application-layer faults: process kills, dependency unavailability, service degradation simulation
- Kubernetes-native chaos: pod eviction, node drain, namespace isolation, and resource quota manipulation
- Database and cache fault injection: connection pool exhaustion, query timeouts, cache invalidation
- Experiment scheduling: run chaos scenarios as recurring jobs aligned to release cycles or post-deployment windows
- Hypothesis-driven testing: define expected system behavior before injecting faults; validate against real outcomes
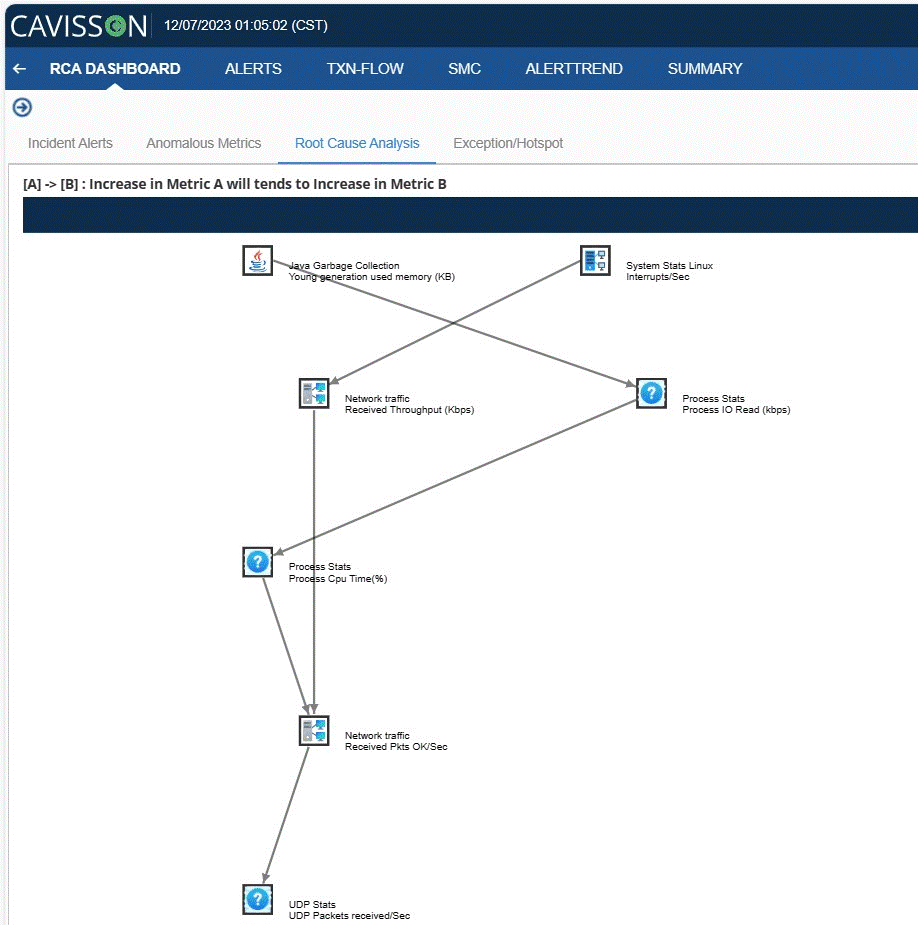
But Chaos Engineering Tool isn’t chaos for chaos’s sake. Every fault injection is observed, correlated, and measured against system behavior in real time — giving your engineering teams actionable evidence, not just colorful dashboards.
The Power of Integration: Performance Testing Tool + Chaos Engineering Tool Together
Here’s where Cavisson’s lifecycle platform philosophy becomes truly differentiated: Performance Testing Tool and Chaos Engineering Tool are designed to run together.
Consider what this enables:
Scenario: Resilience Under Load
Performance Testing Tool drives 20,000 concurrent users through your payment service. At peak load, Chaos Engineering Tool kills two of five payment processor pods. Your test now answers: does the application fail gracefully? Do transactions queue and retry? Does error rate spike above SLO thresholds? Does the remaining infrastructure auto-scale in time to absorb the shock?
No other tool gives you this. You’d need JMeter + LitmusChaos + Datadog + manual correlation to even approximate it. With Cavisson, it’s a single test plan.
Scenario: Dependency Failure Propagation
Performance Testing Tool runs your end-to-end checkout flow. Chaos Engineering Tool introduces 200ms of latency on your inventory service. Your test now validates: does the checkout timeout correctly? Does it surface the right error to the user? Does it retry without creating duplicate orders? This is the kind of scenario that causes P0 incidents in production — and you can now catch it in CI.
Scenario: Pre-Release Validation Gate
Before every major release, a Cavisson-powered validation gate runs functional assertions, load tests at 1.5x expected peak traffic, and a chaos runbook targeting your most critical failure modes — all automated, all in one pipeline stage. Pass/fail criteria include performance baselines, error budgets, and resilience thresholds. If any gate fails, the release doesn’t proceed. No manual sign-off required.
A Platform, Not a Collection of Tools
The word “platform” is overused in enterprise software. Let us be specific about what it means in Cavisson’s context:
- Unified data model: functional test results, performance metrics, and chaos experiment outcomes share the same data schema. Correlation is built-in, not bolted on.
- Single authoring environment: teams write test logic once. The same script drives functional validation, load tests, and chaos-coupled scenarios without translation layers.
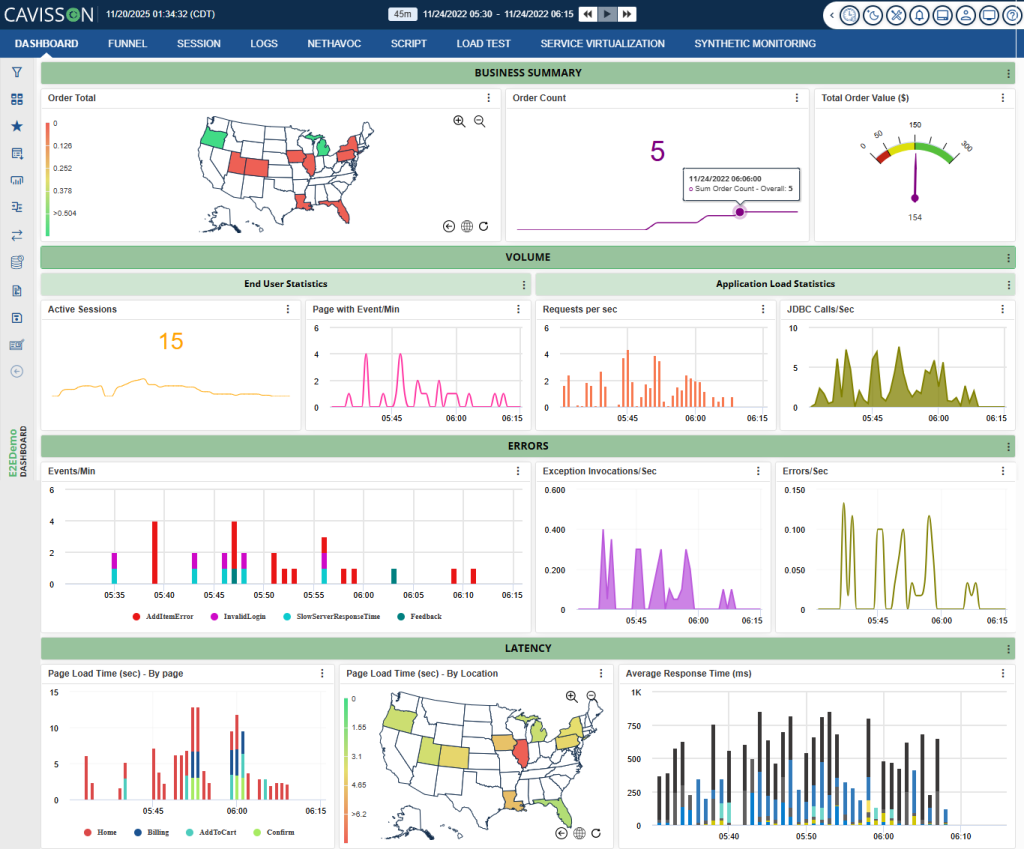
- Centralized observability: all test runs, regardless of type, stream into one analytics engine. Trend analysis, regression detection, and SLO tracking work across the full lifecycle.
- Shared governance: test ownership, access controls, audit trails, and pipeline integrations are managed in one place. No tribal knowledge required.
- Unified reporting: stakeholders — engineering, QA, SRE, and product — see one source of truth about system health across all validation dimensions.
Compare this to a tool-based approach where you’re paying for, integrating, and maintaining five separate products — each with its own data format, pricing model, learning curve, and support contract. The hidden cost of tool fragmentation is enormous, and it compounds as your system complexity grows.
Shift Left, Shift Right — Shift Everywhere
The industry talks about “shifting left” — moving testing earlier in the SDLC. That’s important. But Cavisson enables what we call “shift everywhere”: comprehensive validation at every stage, from first commit to production.
- At commit: lightweight functional assertions on API contracts and core transaction flows
- At PR merge: performance regression tests comparing against baseline, with automatic pass/fail gating
- At staging deploy: full load test suite with synthetic user profiles and realistic data volumes
- At release gate: combined performance + chaos scenarios validating resilience under production-like conditions
- In production: continuous synthetic monitoring with Performance Testing Tool agents, correlated with Chaos Engineering Tool game days for ongoing resilience validation
This isn’t a theoretical architecture — it’s the deployment pattern our enterprise customers run today, integrating Cavisson directly into their GitOps workflows and release automation pipelines.
From Script to Lifecycle: A Real-World Walk-Through
Let’s make this concrete. Here’s how one engineering team transformed a single test script into full lifecycle validation using Cavisson:
Step 1: Start With the Script
The team had a Performance Testing Tool script validating a user login → product search → add to cart → checkout flow. It ran in CI as a functional smoke test — 1 virtual user, assertions on HTTP status codes and response payloads.
Step 2: Add Load
With a profile change — not a script rewrite — the same test ran with 5,000 virtual users ramping over 10 minutes. Performance Testing Tool’s analytics immediately surfaced a P95 latency regression in the product search API above 3,000 concurrent users. The team fixed a missing database index before it reached production.
Step 3: Inject Chaos
With Chaos Engineering Tool integrated, the team added a chaos layer: while Performance Testing Tool drove 3,000 users through checkout, Chaos Engineering Tool terminated the Redis cache pods. The test revealed that without the cache, database query volume tripled — and response times for product search exceeded 8 seconds. A cache fallback strategy was implemented and validated in the same test cycle.
Step 4: Gate the Release
All three test profiles — functional, load, and chaos — were added to the release pipeline as automated gates. The release wouldn’t proceed unless: (a) all functional assertions passed, (b) P95 latency stayed below 500ms under load, and (c) error rate stayed below 0.1% with cache failure injected. Confidence in production behavior went from “we think it’s fine” to “we’ve proven it.”
The Bottom Line: Lifecycle Confidence Over Tool Coverage
The engineering teams that ship reliably don’t have more tools than everyone else. They have better integration between their validation practices. They know that a passing functional test only tells part of the story — and they’ve built the workflows to complete it.
Cavisson was built for this. Performance Testing Tool and Chaos Engineering Tool aren’t products that happen to sit in the same portfolio — they’re components of a coherent lifecycle testing philosophy, engineered to work together and give your teams unified visibility from script to production.
If you’re tired of correlating five dashboards after every incident, tired of your load tests being disconnected from your functional coverage, or tired of discovering resilience gaps only in production, it’s time to move from a collection of tools to a lifecycle platform.
One script. One platform. Full lifecycle confidence.
That’s what Cavisson delivers.
Ready to see Cavisson in action? Request a demo and let our team walk you through a full lifecycle validation scenario tailored to your architecture.
About Cavisson Systems
Cavisson Systems is an enterprise software company specializing in application performance management and full lifecycle quality engineering. With NetStorm, NetDiagnostics, and Chaos Engineering Tool, Cavisson delivers the industry’s most comprehensive platform for functional, performance, and resilience testing — used by leading enterprises across BFSI, e-commerce, healthcare, and telecommunications.