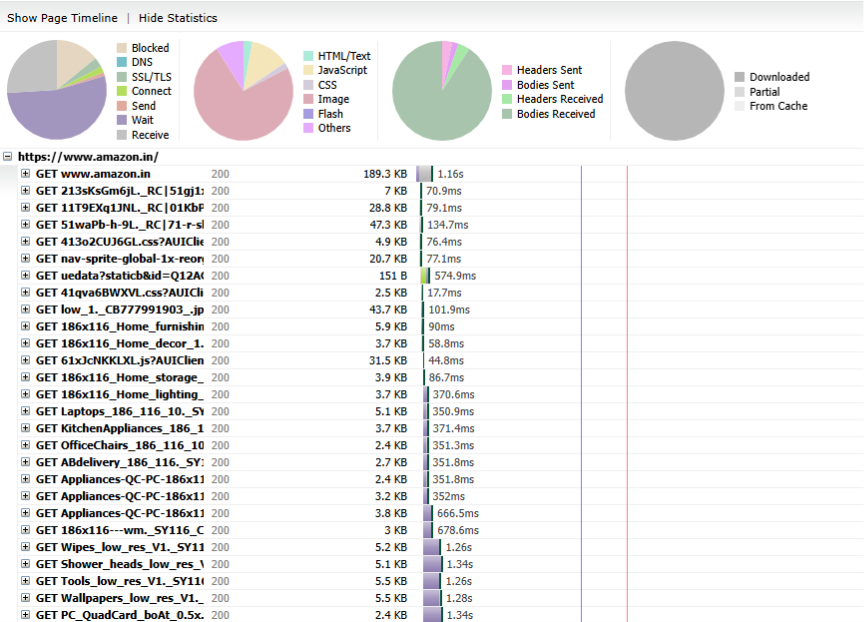
Waterfall charts reveal the complete breakdown of how each resource—CSS, JavaScript, images, fonts, APIs—loaded in the browser. Cavisson’s RBU testing provides a full waterfall view, enabling deeper insight into blocking resources, render-delaying components, slow third-party scripts, sequential vs parallel requests, cache behavior, DNS or SSL delays, and long-running scripts.
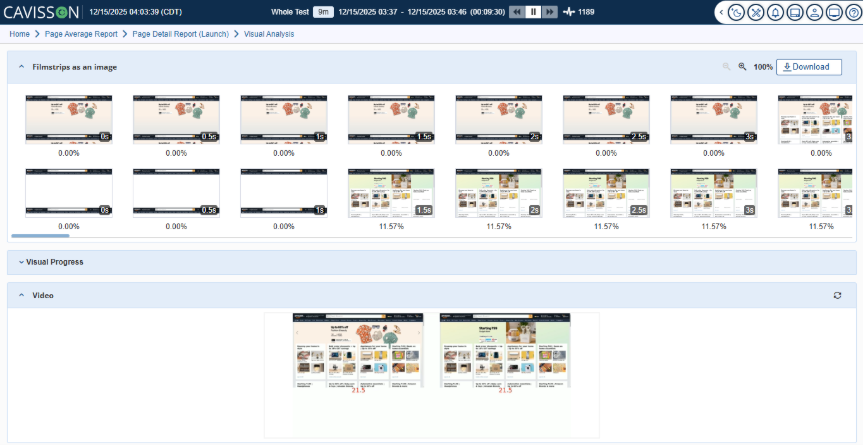
Visual Performance Insights: Filmstrips and Video Playback
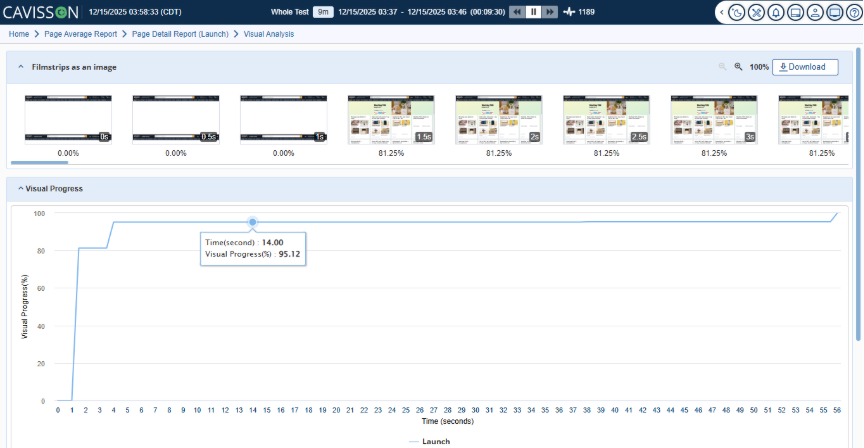
One of the most powerful aspects of RBU testing is its visual playback capability. Cavisson captures how the page loads visually, allowing teams to inspect rendering progress frame-by-frame.
With this feature, teams can view a filmstrip showing visual changes throughout the loading process, a video playback of the entire page load, rendering jumps or layout shifts, moments where the page appears blank or unresponsive, and visual stability issues affecting user-perceived performance.
Page Score Evaluation for Overall Experience Quality
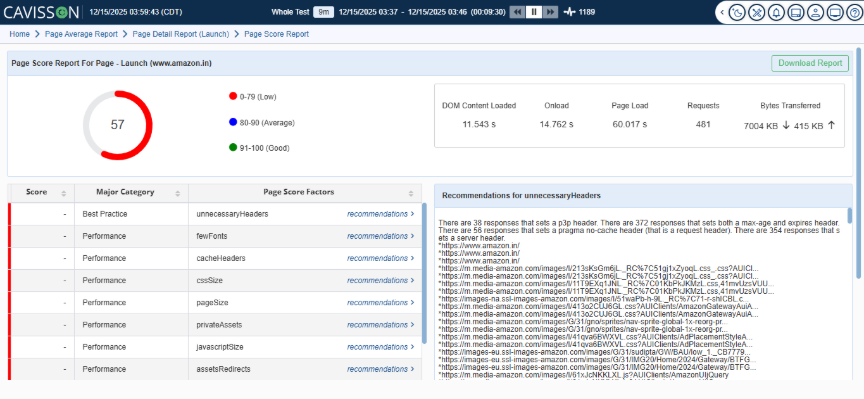
Cavisson provides a comprehensive Page Score Report that aggregates critical browser-side performance metrics into a single, easy-to-interpret score. This score enables teams to quickly assess whether a page is delivering a high-quality user experience or requires optimization.
The Page Score is influenced by key experience factors such as rendering speed, resource efficiency, visual stability, browser execution time, and delays caused by scripts or third-party assets. By consolidating these signals, teams gain a holistic view of real browser performance rather than isolated metrics.
In addition to scoring, Cavisson delivers actionable recommendations for each contributing factor. These recommendations help teams:
- Identify inefficient resources and unnecessary headers
- Optimize JavaScript, CSS, and asset loading
- Reduce render-blocking elements and page load delays
- Improve overall responsiveness and stability
This built-in guidance significantly reduces troubleshooting time and enables faster, data-driven optimization, helping teams move from insight to action with confidence.
Lighthouse Report (Separate Capability for RBU)
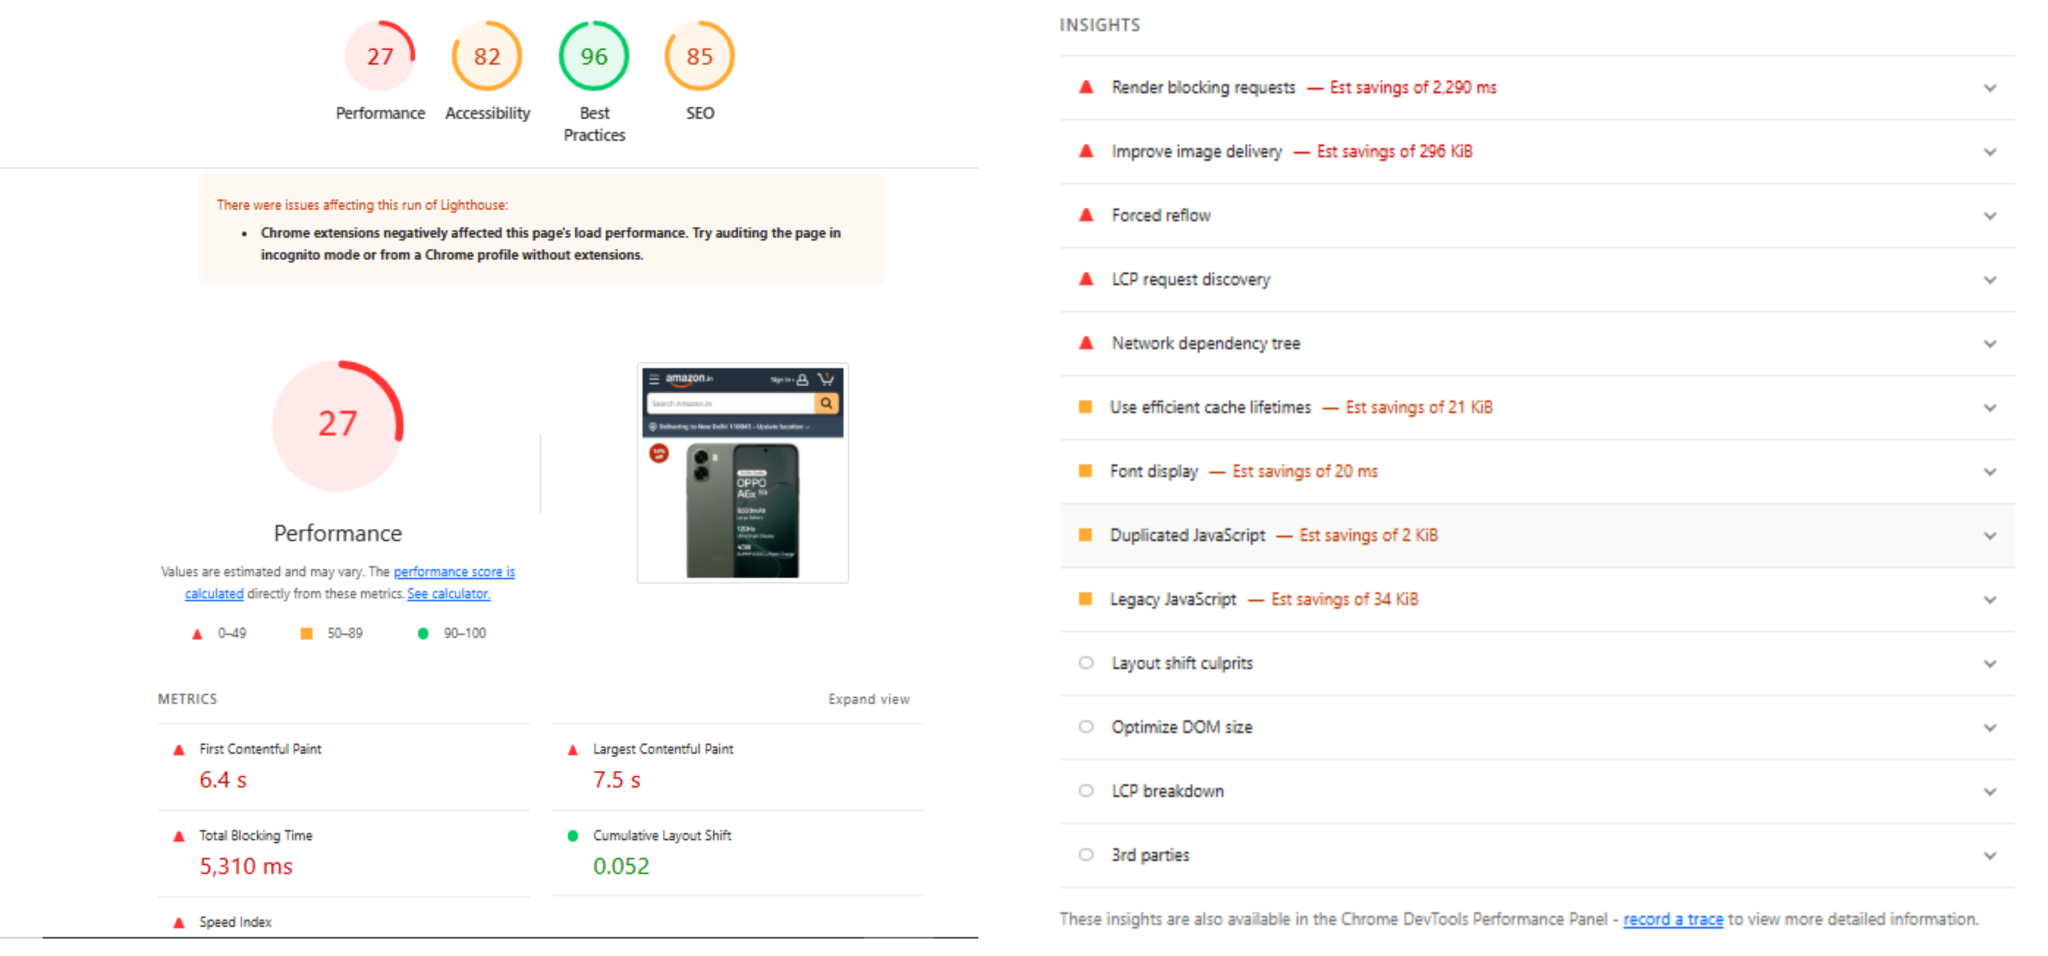
Cavisson also supports Lighthouse reports for Real Browser User (RBU) testing as a standalone capability. These reports provide industry-standard Lighthouse metrics such as Performance, Accessibility, Best Practices, and SEO, generated from real browser executions.
This allows teams to:
- Benchmark pages against Lighthouse standards
- Validate UX quality alongside Cavisson’s deep performance intelligence
- Align performance engineering efforts with modern web experience best practices
Comparing Sessions to Identify Performance Regressions
Applications evolve constantly, and performance often changes across builds. Cavisson allows teams to compare waterfall charts of the same page across multiple sessions, filmstrips between test runs, page load videos between environments or releases, and key performance metrics across builds.
This comparison capability makes it easy to spot regressions, identify unexpected behavior, and validate whether optimizations had the intended effect.
Conclusion
Cavisson’s Real Browser User (RBU) Testing brings a new dimension to performance engineering—one where true user experience becomes measurable, repeatable, and scalable. By combining real browser recordings, load execution, detailed waterfall insights, visual filmstrips, and session-by-session comparison, RBU offers a comprehensive view of how users actually experience applications under varying load conditions.
In a time where page speed directly affects engagement, conversion, and customer satisfaction, RBU testing offers teams the power to optimize performance not just at the server level, but at the experience level. With Cavisson, organizations can ensure their applications are fast, stable, visually smooth, and truly user-centric—even under peak load.