The promise of shift-left performance testing is straightforward: catch performance problems earlier, when they are cheaper and faster to fix. But the practical barrier has always been the same — performance testing requires a separate script, a separate tool, and a separate team. By the time load tests are written and run, the development window has already closed.
What if the functional test your QA engineer wrote on Monday could also run as a load test by Friday — without anyone touching it? What if the script that validates a single checkout transaction could, with zero modification, simulate ten thousand concurrent shoppers under peak load conditions?
This is not a theoretical future state. It is the operational reality that Cavisson delivers today through its purpose-built script portability architecture. In this blog, we explore what true script portability means, how Cavisson’s proprietary scripting framework achieves it, and why competing tools — Grafana k6, Tricentis NeoLoad, and Apache JMeter — fall short of delivering it in practice.
1. The Script Portability Problem
In most organizations, functional and performance testing are treated as entirely separate disciplines. A functional test script validates that a user journey works correctly for one user. A performance test script validates that the same journey works correctly for thousands of users simultaneously. The business logic is identical. The underlying API interactions are identical. Yet teams write them twice, in different tools, using different syntax.
This duplication is not a trivial inconvenience. It creates compounding organizational problems:
- Every API change requires updates in two separate codebases — the functional suite and the performance suite.
- Performance test coverage lags behind functional coverage because there is never enough time to translate new functional tests into load test format.
- Functional QA engineers and performance engineers operate in separate silos, rarely sharing knowledge or collaborating on coverage strategy.
- CI/CD pipelines integrate functional tests automatically; performance tests remain a manual, scheduled activity in pre-production.
The root cause is tool incompatibility. Most performance testing tools were designed in an era when performance testing was a specialized, late-stage activity. Their scripting models reflect that assumption — proprietary formats, protocol-level abstractions, and execution engines that have no concept of BDD scenarios or reusable test modules.
True script portability breaks this pattern. It means that a single script artifact, authored once, can be executed in both a functional context (validate correctness for one user) and a performance context (validate behavior and measure throughput for thousands of users) — with no modification, no conversion, and no additional authoring effort.
THE CORE CHALLENGE | Most load testing tools treat performance scripts as a separate engineering artifact. Cavisson treats them as the same artifact — because they should be. |
2. Cavisson Approach: Portability by Design
Cavisson built NetStorm with a foundational architectural principle: the script that your team writes for functional testing should be directly executable as a load test. This is not accomplished through conversion utilities, import wizards, or post-hoc compatibility layers. It is built into NetStorm’s scripting framework and execution engine at the core.
2.1 The Cavisson Scripting Framework
NetStorm’s proprietary scripting framework is designed to be simultaneously expressive for functional test logic and performant at load testing scale. Key design principles include:
- Unified transaction model: Each script defines transactions — logical units of API interaction — that are meaningful both as functional test cases and as load test building blocks. The same transaction definition executes in both modes.
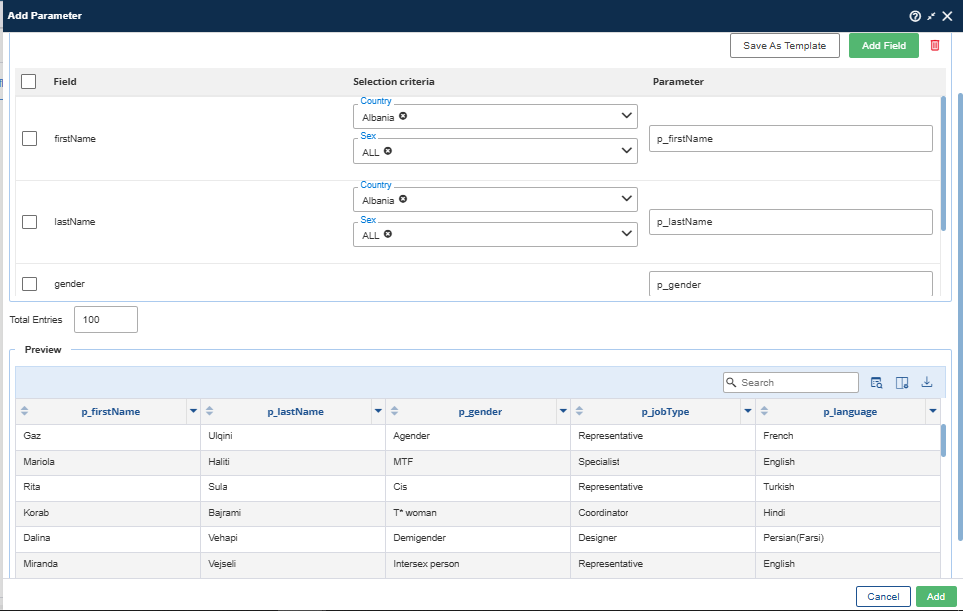
- Declarative parameterization: Scripts reference data variables rather than hardcoded values. At functional execution time, a single dataset row is used. At load execution time, NetStorm injects unique data per virtual user — no script changes required.
- Embedded assertions: Correctness checks are written directly into the script. During load testing, these assertions continue to execute, giving teams both performance metrics and error detection in a single run.
- Protocol abstraction: The scripting layer sits above the protocol implementation. Whether the test exercises REST, SOAP, WebSocket, or database endpoints, the script syntax remains consistent and portable.
- Modular script composition: Reusable script modules — authentication flows, common setup sequences, shared utility functions — are defined once and referenced across multiple test scenarios without duplication.
2.2 How Portability Works in Practice
The workflow Cavisson enables in practice looks like this: A QA engineer authors a functional test script in NetStorm’s scripting environment to validate a new payment processing API. The script covers the full transaction lifecycle — authentication, request construction, response validation, and error handling. It runs in the CI/CD pipeline on every code commit as a functional regression check.
When the sprint closes and the team wants to performance-test the same feature, a NetStorm performance engineer opens the same script, configures a load profile (virtual users, ramp-up curve, duration, think time), and executes it. NetStorm’s execution engine scales the script transparently — managing thread pools, connection handling, data injection, and distributed load generation — while the script itself remains unchanged.
The result: a single script artifact, maintained by one team, running in two contexts. The CI/CD pipeline runs it functionally on every commit. A scheduled load test job runs it under load in the integration environment. Both executions draw from the same script version, eliminating drift between functional and performance test coverage.
2.3 Enterprise-Grade Load Features Built In
Portability does not mean compromise on performance testing capability. NetStorm’s load execution layer adds the enterprise features that production-grade performance testing demands, without requiring any changes to the base script:
- Dynamic correlation: Automatically extract and reinject session tokens, CSRF values, OAuth codes, and other dynamic values across transaction steps.
- Realistic load profiles: Ramp-up, steady state, spike, soak, and step-down profiles configurable independently of script logic.
- Distributed load generation: Scale across multiple injector nodes with central orchestration, transparent aggregation, and per-node diagnostics.
- SLA-based CI gates: Define pass/fail thresholds on P90, P95, P99 response times, error rates, and throughput. Pipeline builds fail automatically when SLAs are breached.
- Real-time analytics: Live dashboards, transaction breakdown, server-side correlation, and drill-down into individual virtual user sessions during execution.
3. Where Grafana k6 Falls Short
Grafana k6 has earned genuine respect in the developer community. It is fast, lightweight, open-source, and integrates naturally into JavaScript-heavy development workflows. For teams starting a load testing practice from scratch in a Node.js or frontend-heavy environment, k6 is a reasonable choice. But as a platform for shift-left script portability, it has a structural limitation that cannot be engineered around.
3.1 JavaScript-Only Execution Model
Every k6 test must be written in JavaScript (ES6+). This is simultaneously k6’s greatest strength and its most significant constraint. For developers who live in JavaScript, k6 feels natural. But for organizations looking to reuse existing functional test assets — scripts authored in any non-JavaScript framework — k6 offers no path to direct execution.
If your functional test suite exists in any format other than JavaScript, reusing those scripts in k6 means rewriting them. Not converting. Not importing. Rewriting, from scratch, in a different language, following k6’s specific API and execution model.
3.2 The Conversion Workaround and Its Limits
k6 does provide a conversion utility that generates k6 scripts from Postman collections and OpenAPI/Swagger specifications. This is genuinely useful for bootstrapping new tests, but it solves a different problem than script portability. Key limitations:
- Conversion is one-directional and one-time: Once a Postman collection is converted to a k6 script, the two artifacts diverge. Every subsequent change to the Postman collection must be manually reflected in the k6 script.
- Conversion loss: The generated k6 script captures the structural skeleton of API requests but loses assertion logic, test data configurations, environment mappings, and complex conditional workflows.
- No path for non-Postman scripts: If functional tests live in any format other than Postman or OpenAPI, the conversion utility does not apply. Teams must write k6 scripts from zero.
3.3 The Dual-Codebase Consequence
In practice, k6 adoption in organizations with existing functional test suites results in a dual-codebase architecture. The functional test suite continues to grow in its original framework. A parallel k6 codebase grows in JavaScript, maintained by a performance engineering sub-team. The two suites cover overlapping scenarios but are never truly synchronized.
This is not a failure of k6 as a tool. It is the predictable consequence of a JavaScript-native execution model in a polyglot testing world. Shift-left performance testing requires that performance tests grow automatically as functional tests grow. k6’s model requires deliberate, manual authoring for every performance scenario.
k6 LIMITATION | k6 requires all load test scripts to be written in JavaScript. Functional test assets from non-JavaScript frameworks cannot be executed directly — they must be fully rewritten, creating a permanent dual-codebase maintenance burden. |
4. Where Tricentis NeoLoad Struggles
Tricentis NeoLoad is a mature, enterprise-grade performance testing platform with deep protocol support, sophisticated analytics, and a long track record in regulated industries. For dedicated performance engineering teams running planned load test campaigns, it delivers significant capability. But its architecture creates meaningful friction for shift-left adoption and functional script reuse.
4.1 Proprietary Project Format
NeoLoad stores test definitions in a proprietary XML-based project format. This format is not compatible with standard functional test artifacts from any external framework. Scripts written in functional testing tools cannot be imported into NeoLoad and executed — they must be translated into NeoLoad’s own representation of the same test scenario.
This translation is not a simple import. It requires understanding NeoLoad’s concepts of virtual users, user paths, populations, and scenarios, and mapping the functional test’s logic onto those constructs. For complex test scenarios with multi-step workflows, conditional logic, and data dependencies, the translation effort is substantial.
4.2 GUI-Centric Heritage Creates CI/CD Friction
NeoLoad was built for a world where performance testing is a planned, GUI-driven activity conducted by a specialized team. Its primary interface is a rich desktop application. While Tricentis has added code-based scripting capabilities through NeoLoad’s YAML “as-code” format, the platform’s heritage shows in workflows that assume GUI interaction for test design, modification, and analysis.
For shift-left adoption, this creates friction at several points:
- Script authoring: Developers and QA engineers comfortable with code-based workflows face a learning curve when performance test changes require GUI navigation rather than text editor modifications.
- Version control: GUI-designed tests produce binary or complex XML artifacts that are difficult to diff, review in pull requests, or merge in source control.
- Pipeline integration: CI/CD pipelines executing NeoLoad tests require the NeoLoad infrastructure to be accessible from build agents, adding operational complexity compared to CLI-native tools.
4.3 Conversion and Ongoing Maintenance Overhead
The effort to migrate functional test scripts into NeoLoad is not a one-time cost. As the application evolves and APIs change, both the functional test suite and the NeoLoad project must be updated independently. The two artifacts never share a codebase. The maintenance overhead that portability is supposed to eliminate persists indefinitely.
Organizations that have adopted NeoLoad for enterprise performance testing often find themselves maintaining three parallel test artifacts: the functional test suite, the NeoLoad project for load testing, and documentation mapping between the two. This is the opposite of shift-left efficiency.
NEOTYS CHALLENGE | NeoLoad’s proprietary format and GUI-centric design create significant migration effort and ongoing maintenance overhead. Functional scripts cannot be directly executed — the translation gap never fully closes. |
5. Where Apache JMeter Falls Short
Apache JMeter is the most widely deployed open-source performance testing tool in the world. Its longevity, protocol breadth, and large plugin ecosystem make it a default choice for many organizations. But JMeter’s age and design philosophy create significant obstacles for modern shift-left workflows and functional script reuse.
5.1 XML-Based Test Plans Are Not Portable
JMeter stores test plans as verbose XML files (.jmx). These files define samplers, listeners, timers, assertions, and configuration elements in a format that is entirely JMeter-specific. Functional test scripts from any external framework must be manually reconstructed as JMeter XML test plans — element by element, sampler by sampler.
This reconstruction is not a minor adaptation. A moderately complex functional test suite with 50 scenarios could represent weeks of JMeter scripting effort. And once the JMeter test plans exist, they begin to diverge from the functional suite immediately, because they are independent artifacts maintained by different people.
5.2 Recording-Based Workflow Assumptions
JMeter’s primary script creation workflow is HTTP recording — capturing browser or application traffic and converting it into a test plan. This approach produces scripts that reflect a single, specific interaction session rather than a parameterized, reusable test scenario. Converting a recording into a production-quality load test requires significant manual post-processing: correlation of dynamic values, parameterization of hardcoded data, cleanup of irrelevant requests, and addition of think time and pacing logic.
For organizations with existing functional test assets, recording-based workflows are irrelevant. The functional tests already define the interactions. The challenge is executing them at scale, not re-recording them.
5.3 Performance at Scale
JMeter’s Java threading model consumes significant memory per virtual user, typically limiting practical concurrency to a few hundred to a few thousand virtual users per injector node without careful tuning. Modern applications requiring tens of thousands of concurrent virtual users demand either aggressive JMeter tuning, distributed injection across many nodes, or migration to more efficient execution engines.
NetStorm’s execution engine is architected for high-concurrency from the ground up, delivering significantly better resource efficiency at scale without requiring users to manage JVM heap settings, garbage collection tuning, or injector topology configuration manually.
5.4 CI/CD Integration Complexity
While JMeter can be integrated into CI/CD pipelines via the JMeter Maven Plugin or command-line execution, the integration is not seamless. Pipeline-level SLA gates require additional configuration, result parsing typically involves third-party plugins or custom scripting, and meaningful dashboards require external tools like InfluxDB and Grafana to interpret JMeter output.
NetStorm provides native CI/CD integration with built-in SLA evaluation, pipeline-ready exit codes, and integrated real-time and historical reporting — without requiring teams to assemble a separate observability stack.
JMETER LIMITATION | JMeter’s XML test plan format, recording-centric workflow, and Java threading model make it poorly suited for script portability or shift-left CI/CD integration without significant custom engineering effort. |
6. Competitive Comparison at a Glance
The following table compares NetStorm, k6, NeoLoad, and JMeter across the dimensions that matter most for shift-left script portability:
Dimension | Cavisson | Grafana k6 | Neotys NeoLoad | Apache JMeter |
Native Script Reuse | ✔ Built-in portability | ✘ JS rewrite needed | ✘ Format conversion | ✘ Manual rebuild |
Functional→Load in CI/CD | ✔ Single artifact | ✔ Partial — new script | ✔ Partial — GUI steps | ✔ Partial — limited |
No Script Modification | ✔ Zero changes | ✘ Full rewrite | ✘ Migration effort | ✘ Significant rework |
Parameterization Support | ✔ Enterprise-grade | ✔ In JS only | ✔ GUI-based | ✔ CSV/DB, complex setup |
Protocol Breadth | ✔ HTTP, HTTPS, gRPC+ | ✔ HTTP/WebSocket | ✔ HTTP, WebSocket | ✔ HTTP, JMS, LDAP+ |
Non-Developer Friendly | ✔ Yes | ✘ JS required | ✔ Partial — GUI yes | ✔ Partial — GUI yes |
Real-Time Assertions | ✔ Per scenario | ✔ In script | ✔ In NeoLoad | ✔ Via listeners |
Maintenance Overhead | ✔ Low — one codebase | ✔ High — dual scripts | ✔ High — dual format | ✔ High — dual scripts |
Enterprise SLA Gates | ✔ Native CI gates | ✔ Partial — manual | ✔ Available | ✔ Partial — plugins |
Distributed Execution | ✔ Built-in | ✔ Cloud-based | ✔ Controller/agents | ✔ Master/slave |
7. The Business Case for Portability
The technical argument for script portability is compelling, but the business case is what drives adoption decisions. Organizations that have achieved functional-to-load script portability report measurable outcomes across three dimensions:
7.1 Faster Time-to-Performance-Insight
When load tests run in the same CI/CD pipeline as functional tests, performance regressions surface within the same sprint they are introduced. A query that degrades from 80ms to 800ms due to a missing index does not survive to staging. It is caught on Tuesday morning, fixed by Tuesday afternoon, and never reaches production. The cost of fixing a performance bug in development is orders of magnitude lower than fixing it in production.
7.2 Reduced Test Authoring Overhead
Organizations that eliminate the functional-to-performance script translation step report significant reductions in performance test creation time. Scripts written for functional coverage automatically populate the performance test suite. New features get performance coverage in the same sprint they are developed, not in a separate performance testing phase weeks later.
7.3 Higher and More Consistent Test Coverage
When performance testing is easy, teams test more. Edge cases, error paths, and secondary user journeys that were previously excluded from load tests because of the authoring overhead now receive coverage automatically. The performance test suite grows in lockstep with the functional suite — not as a perpetually lagging subset of it.
7.4 Unified Team Ownership
Script portability eliminates the organizational handoff between functional QA and performance engineering. A single team owns, maintains, and extends the test suite. Knowledge silos disappear. When an API changes, there is one script to update, not two. When a new scenario is needed, one engineer writes it, and it serves both purposes from day one.
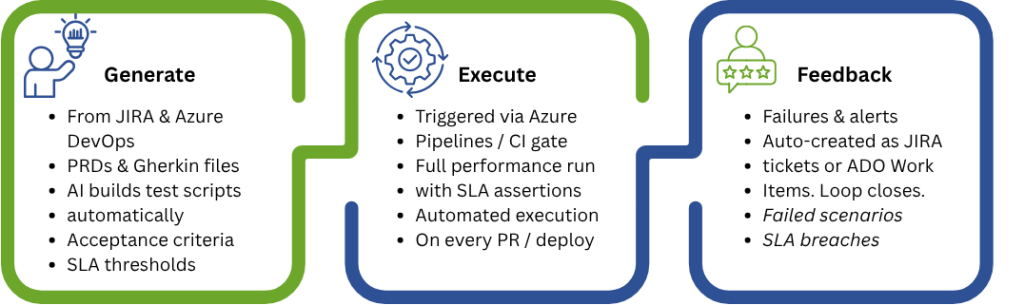
8. Getting Started: The Shift-Left Adoption Path
For teams looking to implement shift-left performance testing through script portability with Cavisson, the path to value is structured and achievable within a single quarter:
- Audit your existing functional test suite. Identify the 10–20 highest-value scenarios — critical user journeys, high-traffic APIs, revenue-generating transactions — that represent realistic production load patterns.
- Migrate those scenarios into NetStorm’s scripting framework. For teams with existing scripts in other tools, Cavisson’s onboarding team provides migration support and tooling to accelerate the transition.
- Configure parameterization. Replace hardcoded values in each scenario with data variables. NetStorm’s data management layer handles per-virtual-user data injection automatically at load execution time.
- Define SLA thresholds. Work with your application and infrastructure teams to establish baseline performance expectations — P95 response time targets, error rate limits, and minimum throughput requirements.
- Integrate into CI/CD. Add NetStorm load test execution as a pipeline stage in your Jenkins, Azure DevOps, or GitHub Actions workflow. Configure pass/fail gates based on your SLA thresholds.
- Establish the operational cadence. Run functional tests on every commit. Run load tests on every merge to main. Run extended soak tests weekly. The same scripts, three execution contexts, zero additional authoring effort.
QUICK WIN | Most teams can achieve functional-to-load portability for their top 10 critical scenarios within the first two weeks of NetStorm adoption — enough to start catching performance regressions in the sprint they occur. |
Conclusion
Shift-left performance testing succeeds or fails based on one practical question: can your team execute the same scripts they write for functional testing as load tests, without duplication, conversion, or additional authoring effort? If the answer is no, performance testing will always lag behind development, always be a late-stage bottleneck, and always require a separate team with a separate toolset.
Cavisson answers that question with an unambiguous yes. Its script portability architecture, built into the execution engine rather than bolted on as a compatibility feature, enables genuine functional-to-load reuse. Scripts are authored once, maintained in a single codebase, and executed in both contexts automatically.
Grafana k6 imposes a JavaScript-only constraint that forces rewriting of any non-JavaScript functional asset. Tricentis NeoLoad’s proprietary format and GUI-centric design create translation overhead that never fully disappears. Apache JMeter’s XML test plan model and recording-centric workflow are structurally misaligned with modern shift-left CI/CD practices.
The organizations that will win on application performance in the coming years are those that make performance testing as automatic as unit testing — continuous, integrated, and owned by the team that writes the code. Cavisson is built to make that future achievable today.
Want to see NetStorm’s script portability in action? Contact Cavisson Systems to schedule a live demonstration with your existing functional test assets.