Product Suite – Datasheet
Introduction
Cavisson Product Suite supports a wide range of technologies and protocols across web as well as mobile platforms for testing, monitoring, and diagnostics purposes. This document provides a quick insight into the supported technologies and protocols as well as monitors provided for capturing stats on application or system level.
Application Performance Monitoring (APM)
Our Application Performance Management (APM) solution is intended for real-time monitoring, diagnostics and management of distributed processing in your application environment using state of art technologies with minimal overhead. Leading Fortune 500 brands rely on NDE to avert risks, reduce revenue loss, and improve customer loyalty by enabling proactive monitoring and real-time diagnosis of application performance issues.
Pre-requisites
- Hardware Requirements: For any of the monitoring component (Cavisson Servers UX monitoring, and application/ server monitoring and diagnostics, and log monitoring) with following configuration:
4 core, 8 GB RAM, 250 GB HDD, 1gbps Network interface with Ubuntu 16.04 and 2 IP addresses each.
- Network Requirements
- Internet connectivity on Cavisson servers for GUI access
- Port 80/443 to be open on Cavisson Server from Internet
- Bi-directional connectivity of ports on Cavisson Server 7891 / 7892 (in case of end-to-end monitoring, where all the 3 monitoring components are in use)
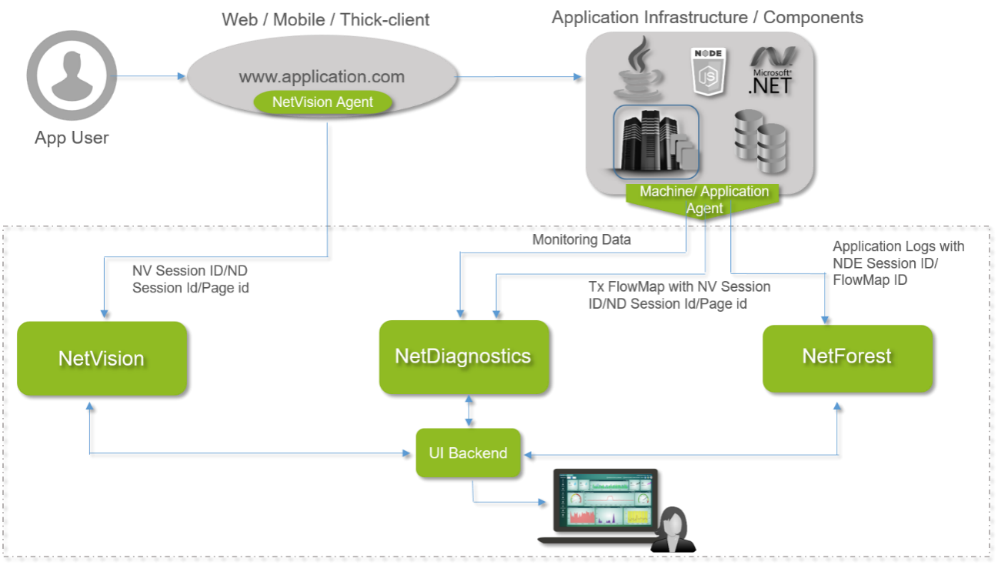
End-to-End Monitoring Architecture
Application Programming Framework
Cavisson APM enhances the visibility with broad coverage of popular programming languages and frameworks including but not restricted to Java, .NET, Node.js, and PHP.

Technologies and Protocols
Cavisson APM supports following technologies and protocols:
| Monitoring Technologies | Details |
| Platform Supports | Linux , Windows , Android based, iOS |
| JVM Support | IBM JVM, Oracle JVM, OpenJDK |
| Database Storage Capabilities | Oracle, MySQL, MSSQL, Postgres, CassandraDB, MongoDB, HBase, NoSQL, Redis, Google Bigtable/Bigquery, Couchbase, Elasticsearch, JDBC |
| App Server / Web Server | OC4J, Tomcat, WebLogic, JBOSS, WebSphere, Nginx, Jetty, Apache2, IIS Server, Play framework, Akka http server, Grizzly, Netty http server, Oracle application server |
| Message oriented middleware support | JMS, TIBCO, RabbitMQ, ActiveMQ, Apache CXF, Apache Axis, IBM MQ, Kafka |
| Frameworks | Spring, Spring Webflux, Hadoop, Tibco, Kafka, Http libraries, Akka platform, Web Container, Enterprise JavaBean Container, JMS, Logging frameworks, Struts, Spring web (MVC), Hystrix , Hibernate, Apache Http client, Google http client, JDK library, Java RMI, Jersey, OkHttp, Memcache, EhCache, Apache Camel, LDAP, JSF |
| Others | Dockers, SNMP, VMWare, Access Logs, Kubernetes, IBMMQ, Vault, HA Proxy, GCP, Kubernetes, Pivotal Cloud Foundry, Redhat Openshift |
*Above monitoring is on cloud as well as on non-cloud.
Monitors
Cavisson APM has numerous monitors to measure metrics at both the system level as well as the application level. Cavisson has developed hundreds of monitors that are commonly and very heavily used by many of our customers.
Below is a list that provides high-level insight into the richness of our monitoring capabilities. Within each stat, numerous metrics are monitored and measured. Cavisson is by no means restricted to providing following mentioned monitors. We have worked with customers in past and have very rapidly developed required monitors on demand.
Monitors for Application Stats
| Application Monitors | Stats |
| WebLogic | JDBC Pool Stats, JMS Queue Stats, JVM Stats, Thread Pool Data, Min Thread Constraint Data, Server Health Stats, Sessions Stats, Transaction Name Data |
| JBoss | Cache Stats, Cached Connection Manager Stats, Global Request Processor, Server Info, Managed Connection Pool, Manager Stats, RAR Deployment, Request Processor, Servlet, Thread Pool, Work Manager Thread Pool |
| JBoss EAP | EAP JDBC Connection Pool, EAP Servlet Stats, EAP Sessions Stats, EAP Thread Pool |
| WebSphere | JDBC Stats, Servlet Data, Thread Pool Data, Session Stats, Liberty Monitor, Liberty JDBC Connection Pool Stats, Liberty Thread Pool Stats, Liberty Session Stats, Liberty JVM Stats, Liberty Servlet Data |
| Redis | Redis Activity Stats, Performance Stats, Cache Stats, System Stats, GC Monitor, GC Stats, DB Stats, Redis Latency stats, Redis Replication Stats, Slave Stats, RedisCacheStatsV2, RedisPerformanceStatsV2, RedisActivityStatsV2 |
| Redis CRDB | Redis CRDB Stats – Pending Writes Max, Pending Writes Min, Incoming Traffic Compresses, Incoming Traffic uncompresses. |
| Apigee API | Deployment Stats, Services Stats by API, Services Stats by HTTP status |
| Hazelcast | Map Stats, MultiMap Stats, Replicated Map Stats, Queue Stats, Cache Stats, Executor Service Stats, Topic Stats |
| HA Proxy | Frontend Stats, Backend Stats |
| Coherence | Cache Stats, Cluster Stats, Cluster Node Stats, Service Stats, Storage Cache Stats |
| Hystrix | Thread Pool Stats |
| Hadoop | HDFS Cluster Stats, Data Node Stats, HBase Cluster Stats, HBase Region Server Stats, Resource Manager Service Stats, Resource Manager Queue Stats, HistoryServerJvm Stats, HistoryServerRpc Stats, HistoryServerUgi Stats |
| Giga Space DB Monitor | Gauges Stats, Histogram Stats, DB Stats, Log Stats, Timers Stats, |
| FCC Application | FCC Stats |
| ETCD | Follower Stats, Node Stats, Store Stats |
| Elastic Search | Cluster Stats, Index Stats, Node Stats, Thread Pool Stats |
| Elastic Search Generic | Cluster Stats, Index Stats, Node Stats, Thread Pool Stats |
| Apache Solr | Solr Cache, Query Handler, Solr Update Handler Stats |
| Endeca | Request Stats |
| GlassFish Application Server | JDBC Pool, Thread Pool |
| TIBCO | Queue Stats, Topic Stats, Service Time Stats |
| Mashry | TcpStatesCount, TcpStats, SystemStatsExtended, ProcessDataEx, System Stats, Application Stats (MasheryClientConnectionData, MasheryDataSource
MasheryThreadStats) |
| Jboss Data Grid | JDBC Pool Stats, Servlet Stats, Session Stats, Thread Pool Stats |
| ehCache | ehCache Stats, JCache Stats |
| AWS | EC2, RedShift |
| Kafka | Broker Stats, Consumer Stats, Producer Topic Stats, Broker Topic Stats, Producer Stats, Latency stats, and Topic Stats |
| Kafka Topic Replication | Kafka Topic Replication Stats |
| Kafka Consumer Group Lag | Kafka Topic Offset, Zookeeper Topic Offset, Kafka Zookeeper Lag |
| Apache Nifi | Connection Stats, Port Stats, Processor Stats, Controller Stats, Process Group Stats, System Stats, Counters Stats, Processor Stats, Flow Stats |
| RabbitMQ | Cluster Stats, Node Stats, Queue Stats |
| Spring Boot | Actuator Stats, Spring Boot Services Stats, Server Stats, Request Stats, Spectator Stats, Extended Actuator Stats |
| Nginx | Nginx Plus Cache Stats, Nginx Plus Server Zone Stats, Nginx Server Stats, Nginx Plus Server Stats, Nginx Plus Upstream Server Stats |
| NginxPlus | Cache Stats, Serverzone Stats, Upstream Stats |
| Zookeeper | Zookeeper Node Stats |
| Async Server | Async Server Message Stats, Async Server Service Stats |
| Spark Server | Spark Server Message Stats, Spark Server Service Stats |
| Camel Server | Camel Server Message Stats, Camel Server Service Stats |
| Windows based HTTP Service | HTTP Service Request Queue Stats Monitor, HTTP Service URL Groups Stats Monitor, IP HTTPS Global Stats Monitor |
| .Net CLR | .Net CLR Exceptions Stats Monitor, .Net CLR Interrop Stats Monitor, .Net CLR Jit Stats Monitor, .Net CLR Class Loading Stats Monitor, .Net CLR Locks and Threads Stats Monitor, .Net CLR Memory Stats Monitor, .Net CLR Remoting Stats Monitor, .Net CLR Security Stats Monitor, .Net Data Provider for SQL Server Stats Monitor |
| Other Windows based Monitors | App Pool WAS Stats Monitor, ASP .Net Active Server Pages Stats Monitor |
| Node JS Heap-GC | Heap used, Heap allocated, types of GC (SCAVENGE, MARKSWEEPCOMPACT), time taken by GC, different types of Heap Space Information (New, old, code, large object, and map space) |
| Node JS Event loop | Latency of all events running in event loop, average/min/max time taken by event loop |
| Node JS Asynchronous Event Monitor | Events per sec for each category of event invocation (Ex. TCP connection, TCP read/write, Timer, File system read/write etc.), Event Execution Time, Delay in Event Execution |
| Node Server | Total requests, response time of all requests, time taken by all requests in network, time taken by server to respond on requests, input throughput (number of bytes read), output throughput (number of bytes write), status code count of all requests, request method type count (get/put/post) |
| Jetty Web Server Monitors | Jetty Thread Pool stats (Busy, Idle, Total, Min, Max thread counts Queue size) and Jetty Session stats (Current sessions, Max sessions, and Session rate) |
| GCP storage bucket permission monitor | Bucket Read Permission, Bucket Write Permission |
| Cloud Foundry | Cloud Foundry App Instances Stats and Cloud Foundry App Stats |
| Instance Health | Instance port status and instance ping response time |
| Cloudant | Used disk space, Free disk space, Key:value pairs emitted per second from map functions, Documents per second through map functions, 2xx, 3xx, 4xx, 5xx, GET, POST, PUT, DELETE, COPY, HEAD, Response Time (ms), Document Reads Per Second, Document Writes Per Second |
| Spring DM | ThreadPool, JDBCProvider |
| AIX | Service stats |
| GCP BigTable | bigtable table stats, bigtable cluster stats |
| GCP BigQuery | bigquery global, bigquery dataset |
| GCP Storage | Storage stats |
| GCP PubSub | Pubsub Subscription stats, pubsub Topic stats |
| GCP DataProc | Hdfs yarn stats, jobs stats |
| GCP Cloud SQL | GCP Cloud SQL Stats – Reserved Cores, Reserved CPU Utilization (Pct), Disk Quota (GB), Bytes Used, Read Operations/Sec, Write Operations/Sec etc. |
| GCP Cloud Engine | GCP Compute Engine Stats – Dropped Bytes/Sec, Dropped Packets/Sec, Average CPU Utilization, Disk Read Bytes/Sec, Throttled Read Bytes/Sec etc. |
| GCP Data flow | GCP Dataflow Stats – Current Active vCPUs, Job Data Watermark Age (Sec), Job Elapsed Time (Min), Job Estimated Element Size (KB), Job System Lag (Sec) etc. |
| GCP Data Store | GCP Datastore Stats – API Request/sec, Index Writes/sec, 5th, 50th, 95th and 99th Percentile Read/Write Size Entities (Bytes) etc. |
| Monitoring Component Using Promethus | Kubernetes container stats, Overall summary stats, name space summary stats, Node Summary Stats |
| Hikari CP | Thread Pool Stats |
| Apache Active MQ | Broker stats, Destination queue stats, Destination queue topic stats |
| JBoss AS 7 | Transaction stats, Service Stats, Prepared Statement Stats , Thread Pool Stats |
| JBOSS AS (JMX) Endpoint | JBOSS AS (JMX) Endpoint Stats |
| Azkaban JMX | jobExecutor, executorManager, jobCallback, webExecutorManager, webTriggerManager, coordinator, executorContainer, webContainer |
| Flume | Source Stats, Sink Stats, Channel Stats |
| Prometheus | Kubernetes Container Stats |
| Bluebird | System Stats, Network Stats, Application Stats, Battery Stats, Process Stats, System Stats, WiFi Stats |
| Windows Peripheral Device Monitor | Monitor Stats, Report Stats |
| ASP.Net Monitors | NA |
| Infinispan | Cache Stats |
| Akamai | Akamai Transaction Stats |
| Apigee | Apigee Transaction Stats |
| Alert REST Monitor | Level – 1 (Tier), Level – 2 (Server) |
| Mosaic Cart | Mosaic Cart Order Stats |
| Server Health Extended | Overall Stats, Server Stats |
| Jira | Jira Server Stats |
| Hive | PS Stats, Memory Heap Stats, Threads Stats |
| Fusion | Buffer Stats, Client Connection Stats, Client Request Stats, GC Stats, Memory Stats, Thread Stats |
| Kafka Burrow | Burrow Lag Stats |
| AWS Lambda | ACEC2Stats, ACLambdaStats |
| Data Power Extensions | IBM Data Power File, IBM Data Power System, IBM Data Power Network |
| Maxwell | Message Stats, Transaction Stats, Replication Stats, Message Publish Stats |
| Generic REST | User configurable (based on JSON response) |
Monitors for Database Stats
| Database Monitors | Stats |
| Oracle | SQL Stats, Activity Stats, Resource Utilization, Wait Events, Transaction Stats |
| Oracle AWR | Cache Sizes Stats, Load Profile Stats, Shared Pool Stats, Time Model Stats, Instance Efficiency Stats, Memory Stats, System Stats |
| Oracle RAC | Oracle Current Blocks Served Stats, Oracle DB Stats, Oracle Wait Events stats, Oracle RAC System Stats, Oracle DB Time Model Stats |
| Oracle Tuxedo | BBStats, Servers stats, Services stats |
| Postgres Database | Background Writer Stats, Database Activity Stats, I/O Activity Stats |
| ATG Oracle DB | ATG Order Stats (Driver Information and query are configured from JSON Configuration file) |
| Cassandra | Compaction Stats, Thread Pool Stats, Column Family Stats, Node Stats, Messages Dropped Stats |
| DB2 | Buffer Pool Stats, Connection Stats, LOG Stats, Cache Stats, IO Activity Stats, Transaction Stats |
| MongoDB | Collection Stats, Server Stats, Database Stats, MongoDB Replication Info |
| MySQL | Activity Stats, Efficiency Stats, Resource Usage Stats, Replication Stats |
| MS SQL | Server Stats, Perf Stats, IO Stats, Hardware Resource Stats, KPI Stats, Query Report |
| Windows based MS SQL DB (Non-Java based) | Microsoft SQL DB Access Methods Stats Monitor, Microsoft SQL DB Buffer Manager Stats Monitor, Microsoft SQL DB General Statistics Stats Monitor, Microsoft SQL DB Latches Stats Monitor, Microsoft SQL DB Locks Stats Monitor, Microsoft SQL DB Memory Manager Stats Monitor, Microsoft SQL DB Plan Cache Stats Monitor, Microsoft SQL Databases Stats Monitor, Microsoft SQL DB Wait Stats Monitor |
| Windows based SQL Server | SQL Server Access Methods Stats Monitor, SQL Server Buffer Manager Stats Monitor, SQL Server CLR Stats Monitor, SQL Server Databases Stats Monitor, SQL Server Executions Stats Monitor, SQL Server General Statistics Stats Monitor, SQL Server Latches Stats Monitor, SQL Server Locks Stats Monitor, SQL Server Memory Manager Stats Monitor, SQL Server Plan Cache Stats Monitor, SQL Server Resource Pool Stats Monitor, SQL Server Error Stats Monitor, SQL Server Statistics Stats Monitor, SQL Server Wait Stats Monitor |
| Couchbase DB Cluster Monitors | Couchbase cluster stats (Cluster memory stats and Cluster Disk stats) |
| Couchbase Node Monitors | Couchbase node stats (Node CPU stats, Node Memory stats, Node Disk stats, and Node Operations stats) |
| Couchbase Bucket Monitor | Couchbase bucket stats (Bucket disk stats, Bucket memory stats, Bucket Operation stats) |
| MySql Replication Group Monitor | NA |
| Spanner DB | Spanner API Request/sec, Spanner Uncompressed Request Bytes Received/Sec,
Spanner Uncompressed Response Bytes Sent/Sec, Spanner Request Latency (Sec), Spanner 5’th Percentile Request Latency, Spanner 50’th Percentile Request Latency, Spanner 95’th Percentile Request Latency, Spanner 99’th Percentile Request Latency, Spanner Nodes, Spanner CPU Utilization(PCT), Spanner Session Count, Spanner Used Size (MB), SpannerMethodStats, SpannerNodeStats, SpannerSystemStats |
| SAP – HANA | SAP HANA Users, SAP HANA Schema Memory, SAP HANA Peak Memory, SAP HANA Resident Memory, SAP HANA Memory Allocation, SAP HANA SavePoints, SAP HANA Backup, SAP HANA Memory Component, SAP HANA Network, SAP HANA Active Connection, SAP HANA Disk Usage. |
| Pgpool | Replication Stats, Replication Slot Stats, Database Stats, Wal File Archieve Stats, Connection Stats, Database Recovery Stats, Log Delay Stats, User Stats, Sync Status, Query Distribution Stats,
Session Waiting Status. |
Monitors for System Stats
| System Monitors | Stats |
| Linux based System Monitors | Network Traffic, Memory Stats, UDP, System Load Stats, Stystem Stats AIX, IOStat, TCP States Count, TCP Stats, Process Stats, Process States Count, Socket Queue Stats, MPStat Linux, Network Delay, Open Files Stats, TCP Listen Queue Stats |
| Windows based System Monitors | Processor Stats Monitor, Window System Stats Monitor, Processor Information Stats Monitor, Logical Disk Stats Monitor, File System Cache Stats Monitor, Physical Disk Stats Monitor, Memory Stats Monitor, TCP IPv4 Stats Monitor, Paging Stats Monitor, Process Stats Monitor, Server Stats Monitor, TCP IP Network Interface Stats Monitor, Web Services Stats Monitor, CPU Load Monitor, Thread Stats Monitor |
Monitors for Network Stats
| Network Monitors | Stats |
| Store Uptime | Store POS Uptime(Minutes) |
| Network Interface | Operational Status, Current Bandwidth(Mbps), Received Throughput(Kbps), Transmitted Throughput(Kbps), Received Pkts Error/Sec, Transmitted Pkts Error/Sec, Received Pkts Discarded/Sec, Transmitted Pkts Discarded/Sec, Incoming Link Utilization(Pct), Incoming Link Utilization(Pct) |
| Network Delay | Network Delay (ms), Network Packet Loss (pct), Network Delay Max Min Ratio |
| Network Device Env | Device Temperature(Celsius), Fan Status |
| Network Device Health | Uptime (Hours), CPU Utilization (pct), Memory Utilization (pct) |
| Fortinet Firewall | Up Time(sec), Active Sessions Count, CPU Usage (pct), Memory Utilization (pct), Total Hard Disk Capacity (MB), Current Hard Disk Usage (MB), Hard Disk Usage (pct), Network Bandwidth Usage (kbps) |
Monitors for Other Technologies / Infrastructure
| Other Monitors | Stats |
| Dockers | Container CPU Stats, Container Stats, Container Disk IO Stats, Container Memory Stats, Container Network Stats, Container System Stats |
| SNMP | F5 System Stats |
| VMWare | ESXi Host CPU Stats, Host ESXi Host Disk Stats, EXSi Host Network Stats, ESXi VM CPU Stats, ESXi Host Memory Stats, ESXi VM Disk Stats, ESXi VM Memory Stats |
| Logs | Netty Server Monitor, Netty Access Log Stats |
| Access Logs | Access Log Stats, Log Pattern, Get Log File, Average Service Time Stats |
| Windows based Logs Monitors | Access Log Stats Monitor, Access Log Extended Stats Monitor, Access Log Extended v2 Stats Monitor, GetLog Monitors |
| IBM MQ | Message Queue Stats, MQ Queue Stats, Channel Stats, Listener Stats, Manager Stats |
| Kubernetes | Cluster Stats, File System Stats, Host CPU Stats, Host Network Stats, Container CPU Stats, Container Memory Stats, Host Memory Stats, Host IO, Host Device Stats, POD Network Stats, POD per name space, Pods per node, Service Stats and Status, Autoscale Config Stats, Container IO |
| Vault | Vault Storage Backend Stats, Vault Secret Engine Stats, Vault Policy and Token Stats, Vault Auth Method Stats, Vault Internal Stats, Mbean Vault Status Stats |
| Android Device Monitor | Android Battery Stats, Android Memory Stats, Android CPU Stats |
| LDAP | Database Health Stats, Disk Utilization, Backlog Stats, Replication Failure, Replication Stats, SYSVOL Replication Stats |
*All modes of Check monitors and Server signature are supported in Windows based monitors too.
Performance Testing
Our extremely powerful load generation solution provides an accurate estimation of Client Perceived Response Time (CPRT) enabling IT companies to guarantee the Service Level Agreements (SLA). Its advanced technology efficiently handles load variables, user realism, application realism and network realism.
Technologies and Protocols
| Technologies | Protocols |
| CRM (Web) | Siebel, PeopleSoft |
| Network | Domain Name Resolution (DNS) |
| File Transfer Protocol (FTP) | |
| Internet Message Access Protocol (IMAP) | |
| Lightweight Directory Access Protocol (LDAP) | |
| Post Office Protocol (POP3) | |
| Simple Mail Transfer Protocol (SMTP) | |
| Authentication, Authorization, and Accounting (Diameter, Radius, TACACS)* | |
| Sockets | |
| Fibre Channel 2 (FC-2) | |
| TR69 | |
| DDOS Attack – UDP | |
| SSL Attack – SSL / TLS | |
| RTMP | |
| CORBA – Java*, RMI – Java* | |
| Rich Internet Applications | Action Message Format (AMF) |
| AJAX TruClient – Firefox | |
| AJAX TruClient – IE | |
| Mobile TruClient | |
| SOA | MQSeries – Client (IBM MQ, TIBCO, Active MQ, Rabbit MQ, Kafka) |
| MQSeries – Server (IBM MQ, TIBCO, Active MQ, Rabbit MQ, Kafka) | |
| Message Oriented Middleware (MOM) | |
| Service Test Vuser | |
| Web Services | |
| Web 2.0 (Web, SOA, RIA combined) | |
| MQTT | |
| Templates | C Vuser |
| Java Vuser
Java over HTTP |
|
| Log Replay | Access Log Replay, Web Service Replay |
| Web and Multimedia | Web (Click and Script) |
| Web (HTTP / HTML) | |
| WebSocket
SockJS |
|
| Responsive Web Design | |
| Messaging | Yahoo Messenger Protocol (YMSG) |
| Extensible Messaging and Presence Protocol (XMPP) | |
| SOAP / REST | HTTP (for non-secure), HTTPS (for secure), XML, JSON, Hessian |
| CI / CD | Jenkin Plugin, Test Suite, Check Engine |
| Finance | AJB, FirstData, Chase Spectrum, Fraud Detection (RED) |
| Video Streaming | HTTP Live Streaming (HLS) |
| Enterprise Resource Planning (ERP) | SAP – Web, SAP – TruClient |
| Real Browser User (RBU) | Desktop RBU, Mobile RBU, Real Device Testing (RDT), Google Lighthouse Plugin |
| Remote Access | Remote Terminal Emulator (RTE) |
| Encoding | Google Protobuf Encoding, AMF, HESSIAN, AES |
* – via Java Vuser
Service Virtualization
Cavisson Service Virtualization software captures and simulates production environment like behavior and performance characteristics of back-end systems and third party applications – needed by development and testing team, and make these characteristics available within test environment.
Technologies and Protocols
It supports a wide range of technologies and protocols across web platforms for testing purposes. This document provides a quick insight into these supported technologies and protocols.
| Services and Protocols | Web Services Protocols: HTTP, HTTPS, HTTP2, REST, SOAP, Hessian |
| Others: IMAP, FTP, DNS, XML, JSON, WebSocket | |
| ESB / Middleware Protocols, TIBCO JMS | |
| Database Protocols: JDBC | |
| Proprietary: TCP, UDP | |
| Platforms: TIBCO-EMS, IBM-MQ, Kafka | |
| SOA Protocols: SOAP, HTTP, XML, REST | |
| SMS Gateway Providers: SMTP, POP3 | |
| Bill Payments Services: Gift card- PINPAD, AJB | |
| Others | Virtual Service Creation Methods: RR pair, Recording, Network Capture (WSDL, RAML, WADL, Swagger), Scratch, Bulk import/recording of transactions |
| VS Test Data Management (Dynamic responses, Magic strings, Data support with random test data, etc.) | |
| Restful API’s and command-line interfaces to integrate with CI/CD | |
| Application Testing (Regression, Functional, Performance testing of the SUT) | |
| Continuous Validation Service (schedule automated test cases) | |
| Conversations and state (Support stateful conversations, remembering a change made in the backend, and reflecting that change with subsequent requests.) | |
| Support for Performance Testing | |
| Mimic live-system response time in VS (Think time) | |
| Service Time delay | |
| Version controlling of Service Definition with easy rollback | |
| Connection timeout simulation | |
| Advanced Thick client and mature web-based portal to create, deploy, manage virtual services | |
| Customization of the ‘out-of-the-box’ features of the tool- “callback” | |
| Support for Data driven virtual services (xls, csv) | |
| Run time changes – Global/ Service level, add, delete | |
| Chunk encoding, Content encoding, Date header, Tracing, Continuous server monitoring (NO) |