Overview
SAP HANA is a latest, in-memory, column-oriented, relational database management system developed and marketed by SAP SE, which can be deployed on-premises or on cloud. It is a combination of hardware and software, which integrates different components, such as SAP HANA Database and SAP System Landscape Transformation (SLT).
This monitor provides monitoring of different stats, such as memory usage by SAP HANA, user connections, long running statements, and so on.
* SAP stands for System Application Product
* HANA stands for High Performance Analytic Appliance
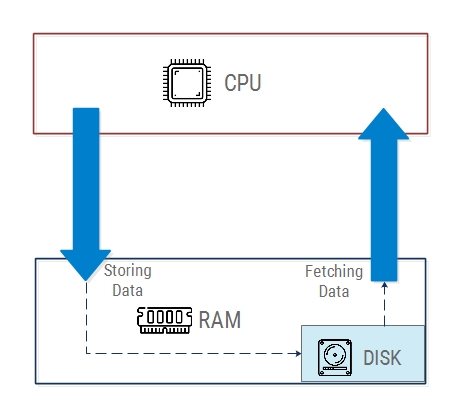
Database Design
In SAP HANA, a disk is attached with RAM (unlike other databases), which enables easy storage and fetching of the data.
SAP HANA Monitoring Capabilities
Cavisson captures following stats for SAP HANA monitoring:
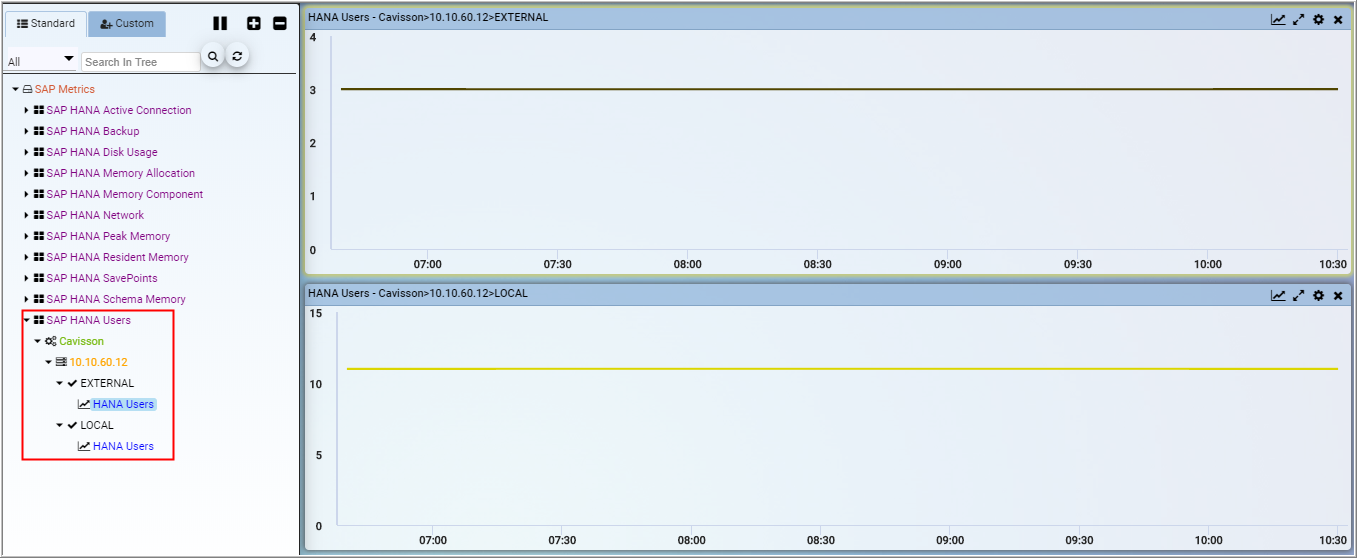
| Graph Name | HANA Users |
|---|
| Data Type | Sample |
|---|
| Graph Description | Display the number of users in database |
|---|
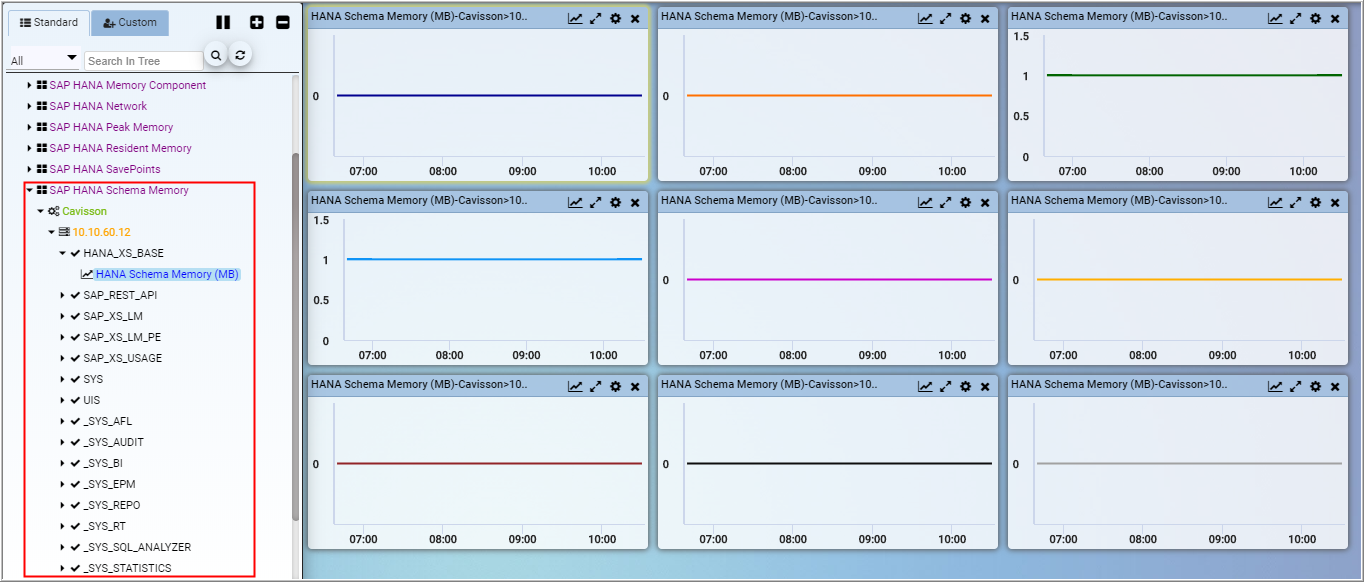
| Graph Name | HANA Schema Memory (MB) |
|---|
| Data Type | Sample |
|---|
| Graph Description | Display the Schema Memory (in MB) of database |
|---|
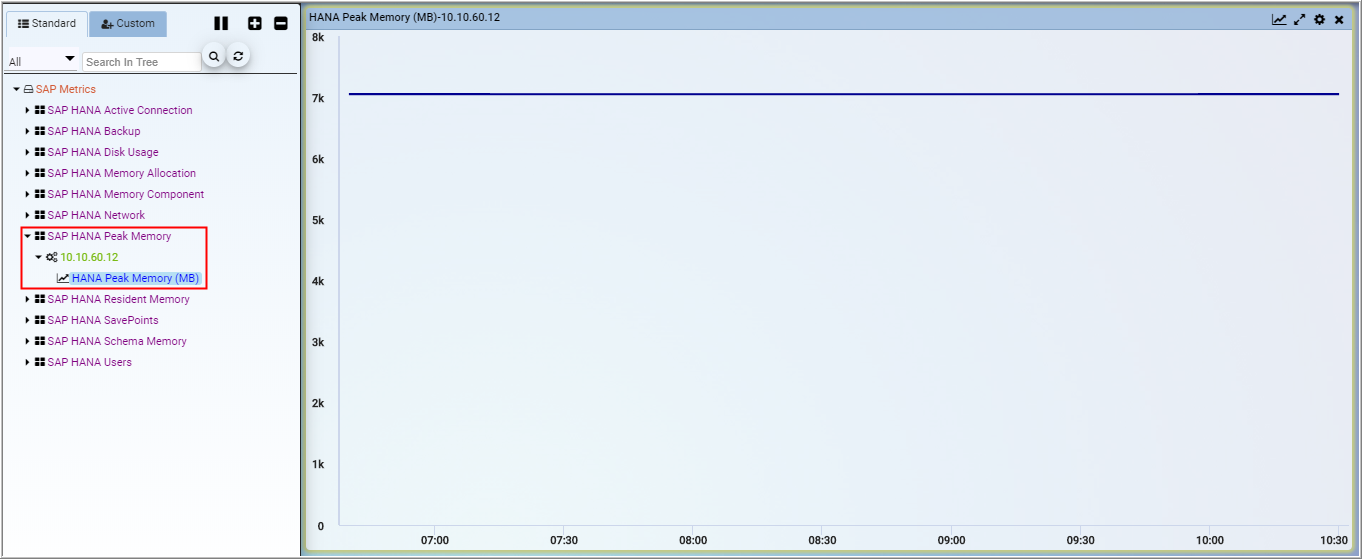
| Graph Name | HANA Users |
|---|
| Data Type | Sample |
|---|
| Graph Description | Display the Peak Memory (in MB) of database |
|---|
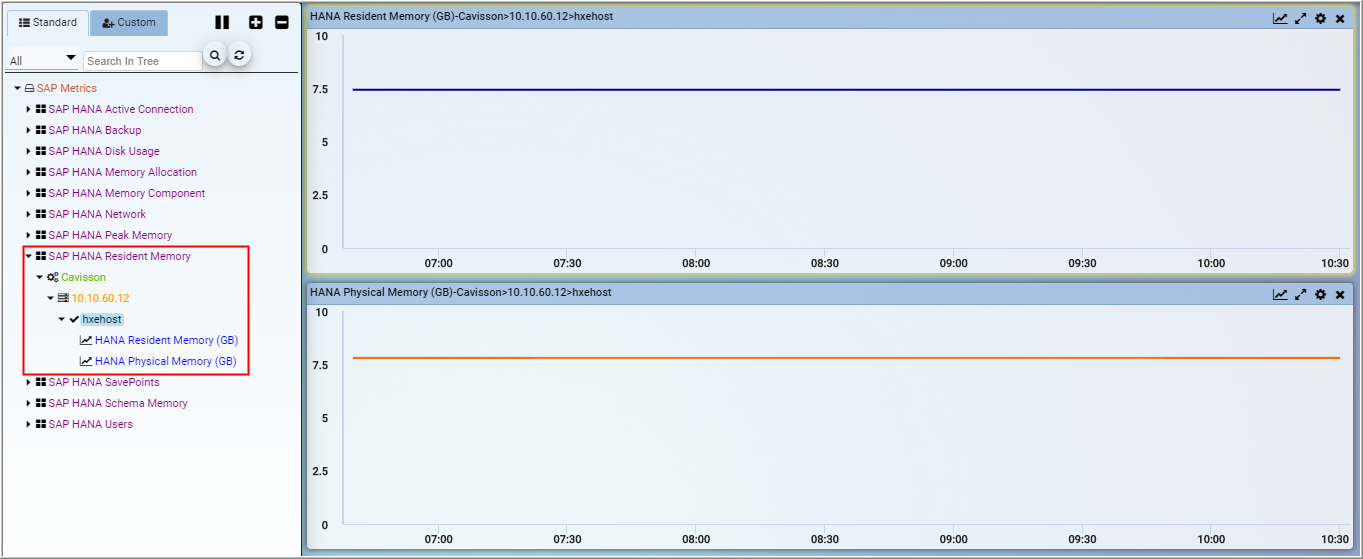
| Graph Name | HANA Resident Memory (GB) | HANA Physical Memory (GB) |
|---|
| Data Type | Sample | Sample |
|---|
| Graph Description | Display the Resident Memory (in GB) of database | Display the Physical Memory (in GB) of database |
|---|
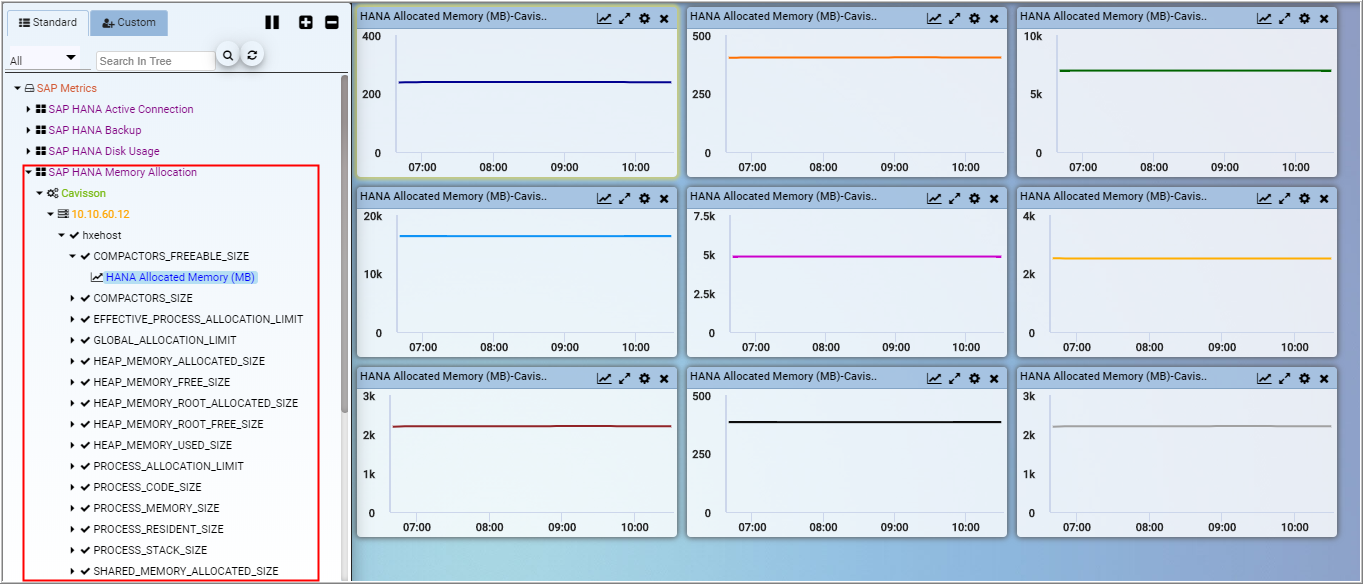
| Graph Name | HANA Allocated Memory (MB) |
|---|
| Data Type | Sample |
|---|
| Graph Description | Display the Allocate Memory in MB of database |
|---|
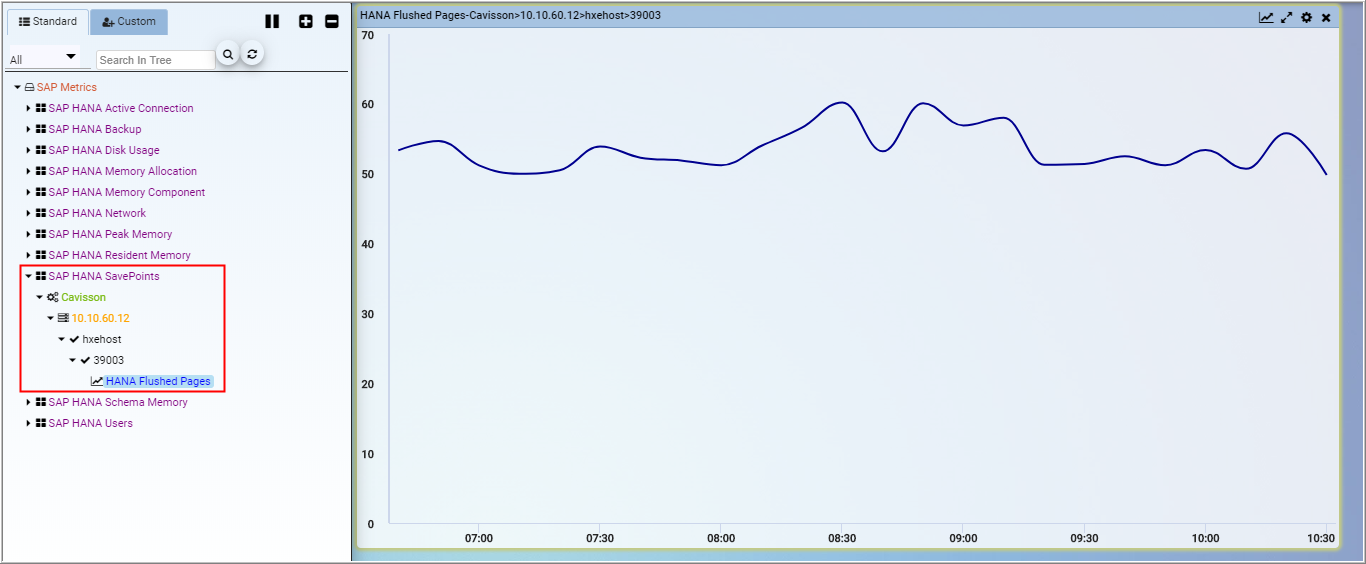
| Graph Name | HANA Flushed Pages |
|---|
| Data Type | Sample |
|---|
| Graph Description | Display the Save Points (flushed pages) stats of database |
|---|
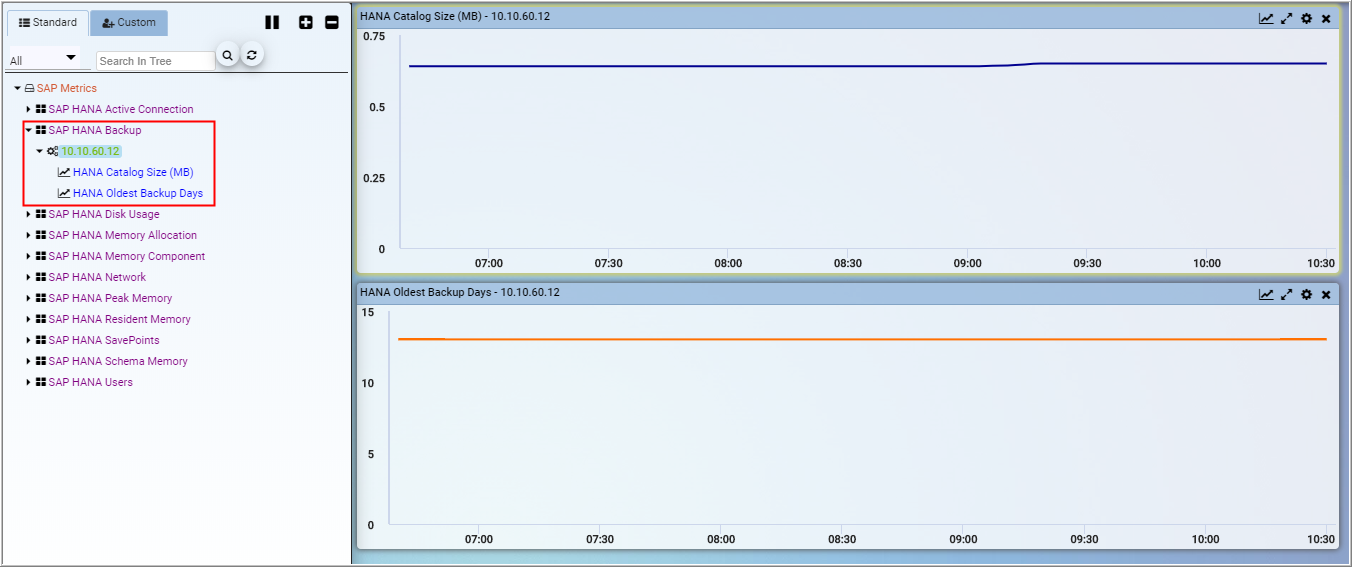
| Graph Name | HANA Catalog Size (MB) | HANA Oldest Backup Days |
|---|
| Data Type | Sample | Sample |
|---|
| Graph Description | Display the catalog size (in MB) of database | Display the oldest backup days of database |
|---|
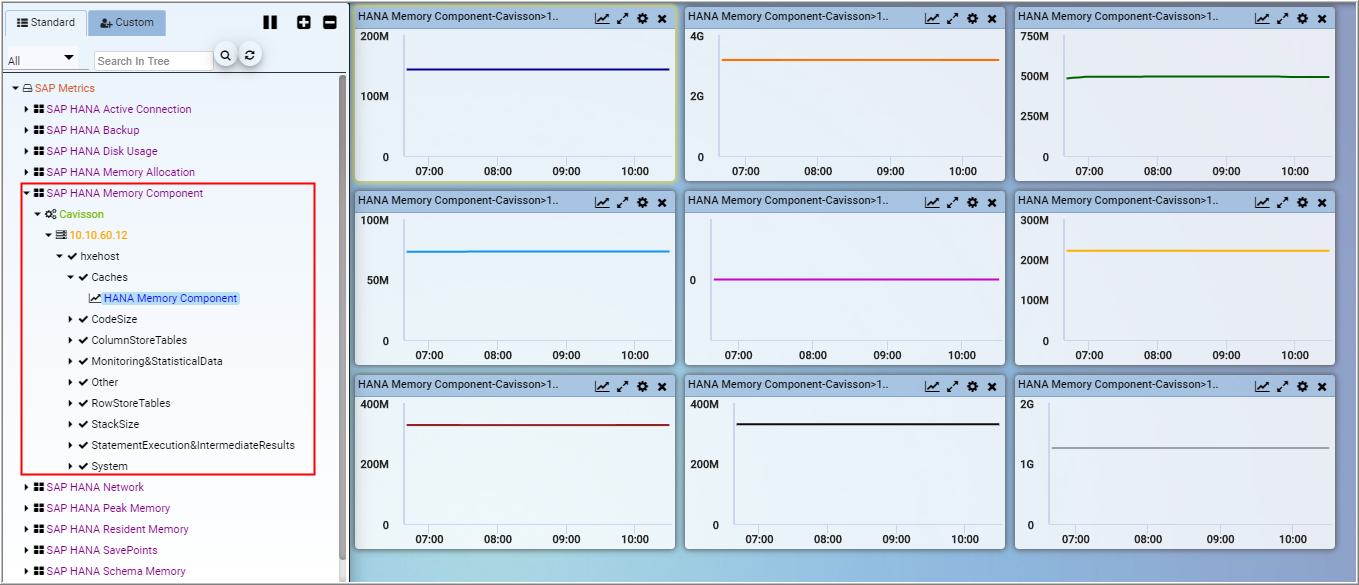
| Graph Name | HANA Memory Component |
|---|
| Data Type | Sample |
|---|
| Graph Description | Display the component memory (in MB) of database |
|---|
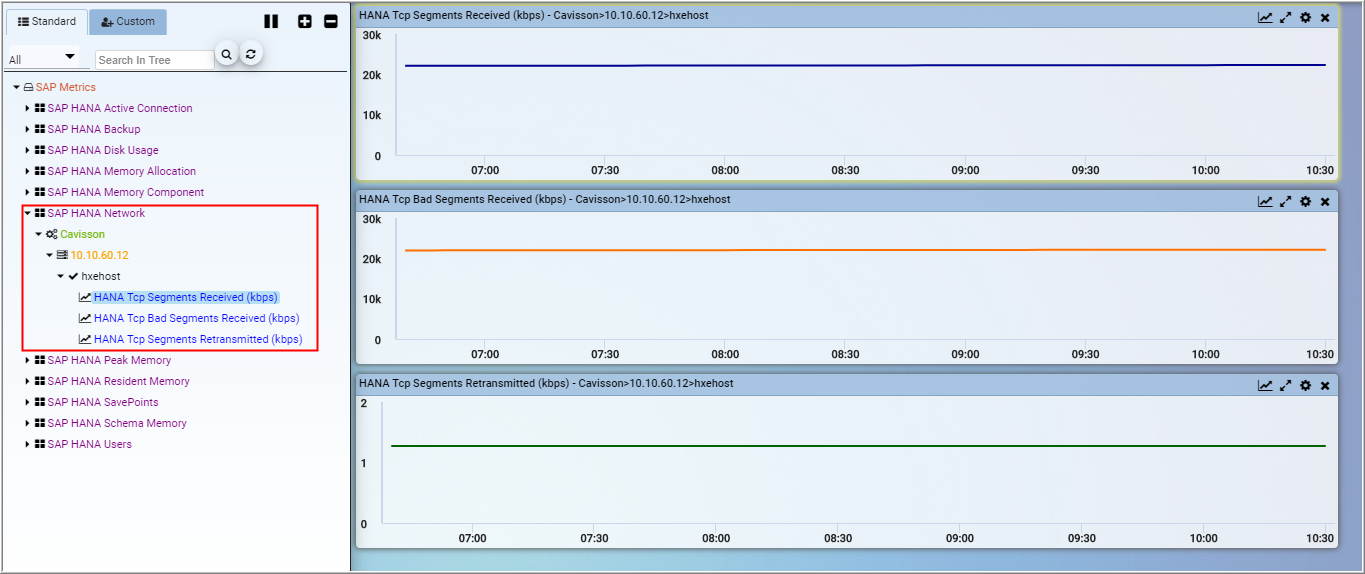
| Graph Name | HANA Tcp Segments Received (kbps) | HANA Tcp Bad Segments Received (kbps) | HANA Tcp Segments Retransmitted(kbps) |
|---|
| Data Type | Rate | Rate | Rate |
|---|
| Graph Description | Display the TcpSegmentsReceived (in kbps) per second stats of database | Display the TcpBadSegmentsReceived (in kbps) stats of database | Display the TcpSegmentsRetransmitted (in kbps) stats of database |
|---|
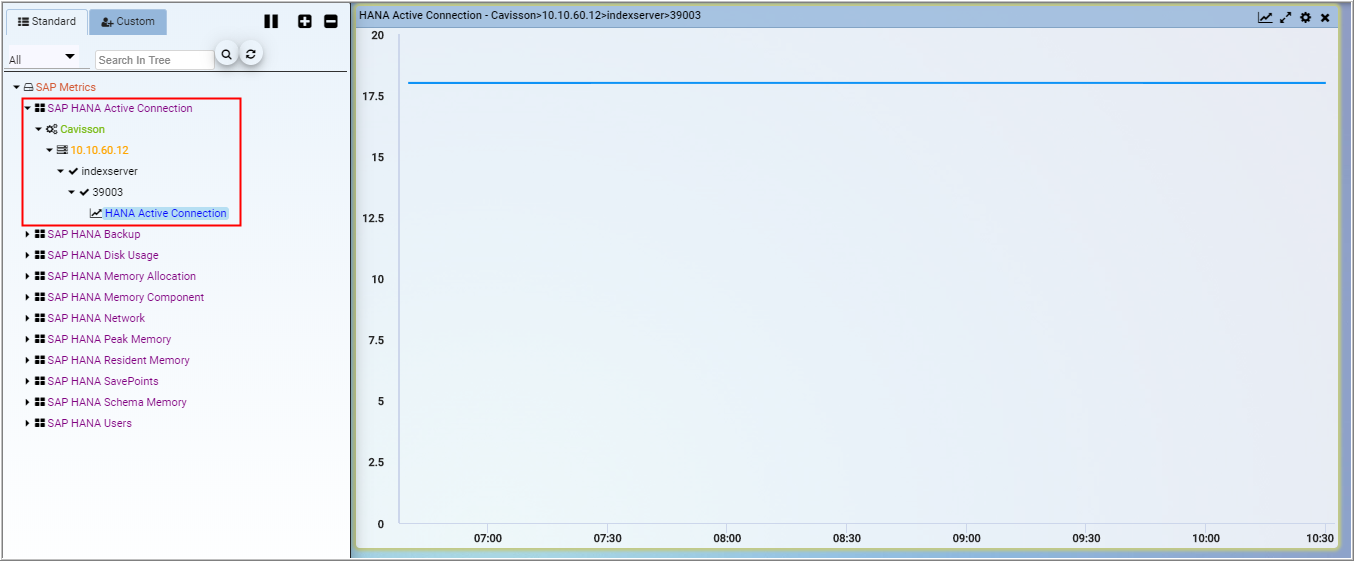
| Graph Name | HANA Active Connection |
|---|
| Data Type | Sample |
|---|
| Graph Description | Display number of active connections of database |
|---|
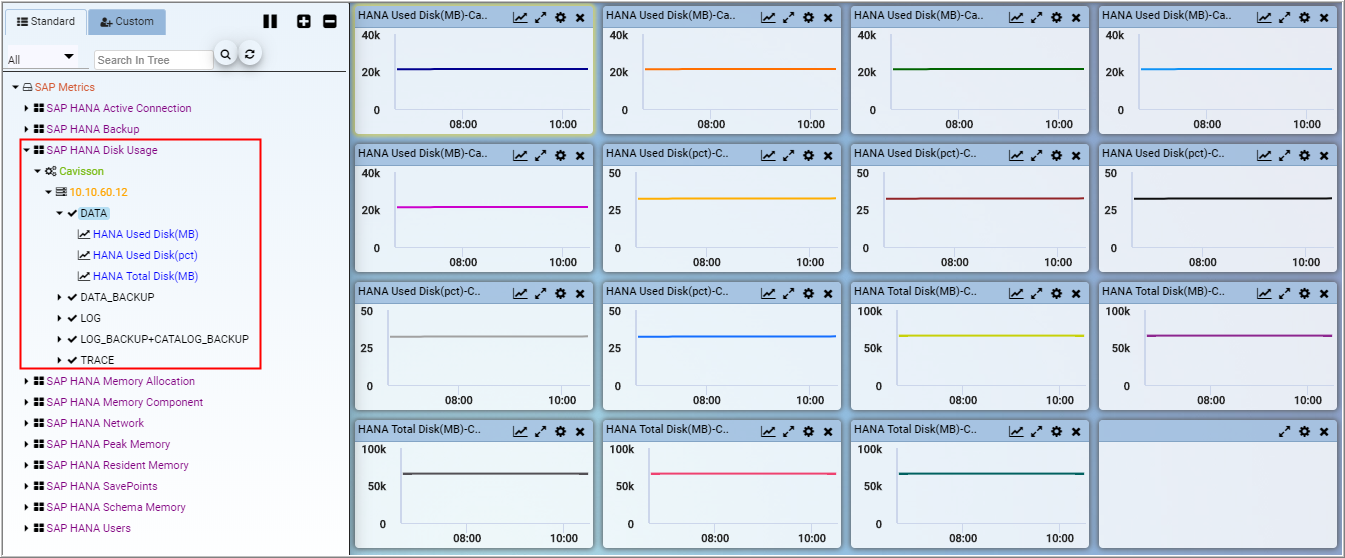
| Graph Name | HANA Used Disk(MB) | HANA Used Disk(pct) | HANA Total Disk(MB) |
|---|
| Data Type | Sample | Sample | Sample |
|---|
| Graph Description | Display the used disk (in MB) stats of database | Display the used disk (in Pct) stats of database | Display the total disk (in MB) stats of database |
|---|