Weblogic Server Monitoring
Overview
We are monitoring stats which are running on weblogic platform. Below metrics are available for Weblogic.
1. Weblogic JDBC Stats
2. Weblogic Session Stats
3. Weblogic JVM Stats
4. Weblogic Thread Pool Data
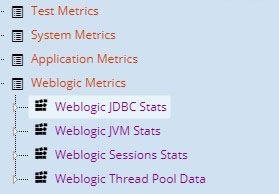
Weblogic Metrics
These four stats further are categorized into different attributes mentioned below.
Weblogic JDBC Stats
This contains following attributes:
- ActiveConnectionsCurrentCount: – The number of connections currently in use by applications.
- ActiveConnectionsAverageCount: – Average number of active connections in this instance of the data source. Active connections are connections in use by an application.
- ActiveConnectionsHighCount: – Highest number of active database connections in this instance of the data source since the data source was instantiated. Active connections are connections in use by an application.
- TotalConnectionsCreated:– The cumulative total number of database connections created in this data source since the data source was deployed.
- Current Capacity: – The current count of JDBC connections in the connection pool in the data source.
- Current Capacity High Count: – Highest number of database connections available or in use (current capacity) in this instance of the data source since the data source was deployed.
- TotalFailedReserveRequests: – The cumulative, running count of requests for a connection from this data source that could not be fulfilled.
- Failures To Reconnect Count: – The number of times that the data source attempted to refresh a database connection and failed.Failures may occur when the database is unavailable or when the network connection to the database is interrupted.
- Highest Number Available: – Highest number of database connections that were idle and available to be used by an application at any time in this instance of the data source since the data source was deployed.
- Highest Number UnAvailable: – Highest number of database connections that were unavailable (in use or being tested by the system) in this instance of the data source since the data source was deployed.
- Leaked Connection Count: – The number of leaked connections. A leaked connection is a connection that was reserved from the data source but was not returned to the data source by calling close().
- NumberOfPoolsAvailable: – The number of database connections that are currently idle and available to be used by applications in this instance of the data source.
- NumberOfPoolsUnAvailable: – The number of connections currently in use by applications or being tested in this instance of the data source.
- TotalPrepareStatementCacheAccess: – The cumulative, running count of the number of times that the statement cache was accessed.
- TotalReserveRequest: – The cumulative, running count of requests for a connection from this data source.
- Wait Seconds High Count: – The highest number of seconds that an application waited for a connection (the longest connection reserve wait time) from this instance of the connection pool since the connection pool was instantiated.This value is updated when a completed getConnection request takes longer to return a connection than any previous request.
- Waiting For Connection Current Count: – The number of connection requests waiting for a database connection.
- TotalWaitingForConnectionFailure: – The cumulative, running count of requests for a connection from this data source that had to wait before getting a connection and eventually failed to get a connection.Waiting connection requests can fail for a variety of reasons, including waiting for longer than the ConnectionReserveTimeoutSeconds.
- TotalWaitingForConnection:– The cumulative, running count of requests for a connection from this data source that had to wait before getting a connection, including those that eventually got a connection and those that did not get a connection.
- TotalWaitingForConnectionSuccess: – The cumulative, running count of requests for a connection from this data source that had to wait before getting a connection and eventually succeeded in getting a connection.
- WaitingForConnectionHighCount: – Highest number of application requests concurrently waiting for a connection from this instance of the data source.
Weblogic JVM Stats
This contains following attributes:
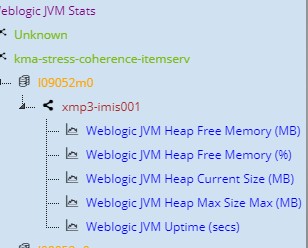
- WeblogicJVMHeapFreeMemory(MB):– The current amount of memory that is available in the JVM heap.
- WeblogicJVMHeapFreeMemory(%):– Percentage of the maximum memory that is free.
- WeblogicJVMHeapCurrentSize(MB):– The current size of the JVM heap.
- WeblogicJVMHeapMaxSizeMax(MB):– The maximum free memory configured for this JVM.
- WeblogicJVMUptime(secs):– The number of milliseconds that the Virtual Machine has been running.
Weblogic Session Stats
This contains following attributes:
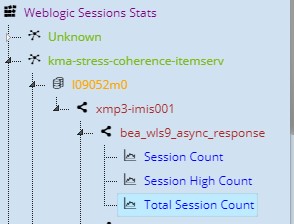
- SessionCount:– Number of open sessions in use by an application.
- SessionHighCount:– High water mark of the total number of open sessions in server.
- TotalSessionCount:– Total number of sessions opened in an application.
Weblogic Thread Pool Data
This contains following attributes:
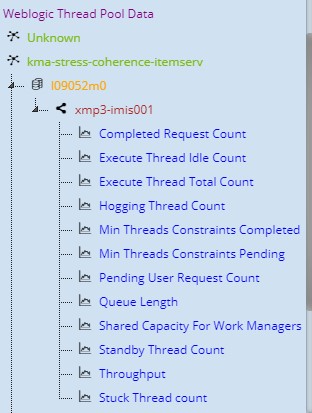
- CompletedRequestCount:– The number of completed requests in the priority queue.
- ExecuteThreadIdleCount:– The number of idle threads in the pool. This count does not include standby threads and stuck threads. The count indicates threads that are ready to pick up new work when it arrives.
- ExecuteThreadTotalCount:– The total number of threads in the pool.
- HoggingThreadCount:– returns the threads that are being hogged by a request right now. These threads will either be declared as stuck after the configured timeout or will return to the pool before that. The self-tuning mechanism will backfill if necessary.
- MinThreadsConstraintsCompleted:– Number of requests with min threads constraint picked up out of order for execution immediately since their min threads requirement was not met. This does not include the case where threads are idle during schedule.
- MinThreadsConstraintsPending:– Number of requests that should be executed now to satisfy the min threads requirement.
- PendingUserRequestCount:– The number of pending user requests in the priority queue. The priority queue contains requests from internal subsystems and users. This is just the count of all user requests.
- QueueLength:– The number of pending requests in the priority queue. This is the total of internal system requests and user requests.
- SharedCapacityForWorkManagers:– Maximum amount of requests that can be accepted in the priority qeueue. Note that a request with higher priority will be accepted in place of a lower priority request already in the queue even after the threshold is reached. The lower priority request is kept waiting in the queue till all high priority requests are executed. Also note that further enqueues of the low priority requests are rejected right away.
- StandbyThreadCount:– Returns the number of threads in the standby pool. Threads that are not needed to handle the present work load are designated as standby and added to the standby pool. These threads are activated when more threads are needed.
- Throughput:– The mean number of requests completed per second.
- StuckThreadCount:– The number of threads that are considers stuck on the basis of any stuck thread constraints.