Spring Boot Monitoring
Overview
Spring Boot is a Spring framework module which provides RAD (Rapid Application Development) feature to the Spring framework. It is highly dependent on the starter templates feature, which is very powerful and works flawlessly.
Spring Boot aims to make it easy to create Spring-powered, production-grade applications and services with minimum fuss. It takes an opinionated view of the Spring platform so that new and existing users can quickly get to the bits they need.

Spring Boot includes a number of additional features to help you monitor and manage your application when you push it to production. You can choose to manage and monitor your application by using HTTP endpoints or with JMX. Auditing, health, and metrics gathering can also be automatically applied to your application.
An actuator is used monitoring our app, gathering metrics, understanding traffic or the state of our database becomes trivial with this dependency. The main benefit of this library is that we can get production grade tools without having to actually implement these features ourselves. Actuator is mainly used to expose operational information about the running application – health, metrics, info, dump, env, etc. It uses HTTP endpoints or JMX beans to enable us to interact with it.
The major business driver for this requirement is as follows:
- Monitoring Spring boot services metrics through REST API.
- Monitoring Spring boot actuator metrics through REST API.
- Monitoring Spring boot spectator metrics through REST API.
Graph Description
Spring Boot Service Stats
| Metric | Type | Description |
|---|---|---|
| Average Response Time (Sec) | Rate | Average Response time obtained from this server in seconds. |
| Responses 1xx/Sec | Rate | Number of responses per second obtained from this server with HTTP status code of 1xx series. |
| Responses 2xx/Sec | Rate | Number of responses per second obtained from this server with HTTP status code of 2xx series. |
| Responses 3xx/Sec | Rate | Number of responses per second obtained from this server with HTTP status code of 3xx series. |
| Responses 4xx/Sec | Rate | Number of responses per second obtained from this server with HTTP status code of 4xx series. |
| Responses 5xx/Sec | Rate | Number of responses per second obtained from this server with HTTP status code of 5xx series. |
Spring Boot Actuator Stats
| Metric | Type | Description |
|---|---|---|
| Number of Young GC/Min | Rate | Number of young gc cycles occurred within a minute while scenario is running. |
| Number of Tenured GC/Min | Rate | Number of tenured gc cycles occurred within a minute while scenario is running. |
| Total number of GC/Min | Rate | Number of gc cycles (sum of young and tenured gc) occurred within a minute while scenario is running. |
| Cumulative number of Young GC | cumulative | Cummulative number of young gc cycles occurred in whole test duration. |
| Cumulative number of Tenured GC | cumulative | Cummulative number of tenured gc cycles occurred in whole test duration. |
| Cumulative number of GC | cumulative | Cummulative number of all gc cycles occurred in whole test duration. |
| Time taken by Young GC (Sec)/Min | sample | Rate of young gc cycles time that is taken in a minute. |
| Time taken by Tenured GC (Sec)/Min | sample | Rate of tenured gc cycles time that is taken in a minute. |
| Total time taken by GC (Sec)/Min | sample | Rate of all gc cycles time that is taken in a minute. |
| Cumulative time taken by Young GC (Sec) | cumulative | Cummulative time taken by all young gc cycles in seconds. |
| Cumulative time taken by Tenured GC (Sec) | cumulative | Cummulative time taken by all tenured gc cycles in seconds. |
| Cumulative time taken by GC (Sec) | cumulative | Cummulative time taken by all gc cycles in seconds. |
| Time per Young GC (Sec) | Times | Average time of young gc in seconds. |
| Time per Tenured GC (Sec) | Times | Average time of tenured gc in seconds. |
| Time per GC (Sec) | Times | Average time of all gc in seconds. |
| Time used in GC (Pct) | sample | Average time used in gc in percentage. |
| Cumulative time used in GC (Pct) | cumulative | Cummulative time used in gc in percentage. |
| JVM Heap allocated memory (MB) | sample | The overall allocated memory of java virtual machine in mega bytes. |
| JVM Heap used memory (MB) | sample | The overall used memory of java virtual machine in mega bytes. |
| JVM Heap used memory (Pct) | sample | The overall used memory of java virtual machine in percentage. |
| JVM Non Heap allocated memory (MB) | sample | The overall allocated memory of Non java virtual machine in mega bytes. |
| JVM Non Heap used memory (MB) | sample | The overall used memory of Non java virtual machine in mega bytes. |
| JVM Non Heap used memory (Pct) | sample | The overall used memory of Non java virtual machine in percentage. |
| Total allocated memory (MB) | sample | The overall allocated memory in mega bytes. |
| Total used memory (MB) | sample | The overall used memory in mega bytes. |
| Total used memory (Pct) | sample | The overall used memory in percentage. |
| Processors Count | sample | Number of processors. |
| Instance Uptime (Sec) | sample | Application context uptime in Seconds. |
| Uptime (Sec) | sample | System uptime in Seconds. |
| System load Average | sample | Average system load. |
| Peak Threads | sample | Number of Peak Threads. |
| Daemon Threads | sample | Number of Daemon Threads. |
| Total Started Threads | sample | Total number of Threads started. |
| Total Threads | sample | Number of total Threads. |
| Total Classes | sample | Number of Classes. |
| Loaded Classes | sample | Number of Loaded classes. |
| Unloaded Classes | sample | Number of Unloaded classes. |
| Active Http Sessions | sample | Number of Active Http Sessions. |
Spring Boot Service Extended Stats
| Metric | Type | Description |
|---|---|---|
| Average Response Time (Sec) | Rate | Average Response time obtained from this server in seconds. |
| Responses 1xx/Sec | Rate | Number of responses per second obtained from this server with HTTP status code of 1xx series. |
| Responses 2xx/Sec | Rate | Number of responses per second obtained from this server with HTTP status code of 2xx series. |
| Responses 3xx/Sec | Rate | Number of responses per second obtained from this server with HTTP status code of 3xx series. |
| Responses 4xx/Sec | Rate | Number of responses per second obtained from this server with HTTP status code of 4xx series. |
| Responses 5xx/Sec | Rate | Number of responses per second obtained from this server with HTTP status code of 5xx series. |
| Responses 1xx (Pct) | sample | Percentage of 1xx response. |
| Responses 2xx (Pct) | sample | Percentage of 2xx response. |
| Responses 3xx (Pct) | sample | Percentage of 3xx response. |
| Responses 4xx (Pct) | sample | Percentage of 4xx response. |
| Responses 5xx (Pct) | sample | Percentage of 5xx response. |
Spring Boot Extended Actuator Stats
| Metric | Type | Description |
|---|---|---|
| Actuator System Load Average | sample | Average system load over a period of time in one minute. |
| Actuator System CPU Time (Sec) | sample | Time spent (in seconds) by tasks of the Spring boot in kernel mode. |
| Actuator User CPU Time (Sec) | sample | Time spent (in seconds) by tasks of the Spring boot in user mode. |
| Actuator JVM Memory Committed (MB) | sample | Amount of memory in Megabytes that is committed for the JVM to use. |
| Actuator JVM GC Memory Allocated (MB) | sample | Amount of memory in Megabytes allocated for the JVM. |
| Actuator JVM Maximum Memory (MB) | sample | Maximum amount of memory in Megabytes that can be used for memory management. |
| Actuator JVM Memory Used (MB) | sample | Amount of used memory in Megabytes. |
| Actuator JVM GC Promoted Memory (MB) | sample | Amount of memory (live objects) moved from young space to survivor in Megabytes. |
| Actuator JVM Buffer Memory Used (MB) | sample | An estimate of the memory in Megabytes that the JVM is using for this buffer pool. |
| Actuator JVM GC Maximum Data Size (MB) | sample | Maximum size of object in Megabytes can be persist in JVM. |
| Actuator JVM GC Live Data Size (MB) | sample | Size of live object in Megabytes persists in JVM. |
| Actuator JVM GC Pause (ms) | sample | Average GC pause time in milliseconds. |
| Actuator JVM Live Threads | sample | Number of live threads in JVM. |
| Actuator JVM Total Buffer Capacity (MB) | sample | An estimate of the total capacity of the buffers in this pool in Megabytes. A buffer is a chunk of memory typically used to interface Java to the OS I/O subsystems, for example as a place where the OS writes data as it receives it from a socket or disk, and from which Java can read directly. |
| Actuator JVM Buffer Count | sample | An estimate of the total count of the buffers in this pool. |
| Actuator Tomcat Global Request/Sec | Rate | Number of request tomcat received per second. |
| Actuator Tomcat Created Sessions/Sec | Rate | Number of created sessions per second in tomcat container. |
| Actuator Tomcat Expired Sessions/Sec | Rate | Number of expired sessions per second in tomcat container. |
| Actuator Tomcat Rejected Sessions/Sec | Rate | Number of rejected sessions per second in tomcat container. |
| Actuator Tomcat Sessions Active Current | sample | Active sessions running in tomcat container. |
| Actuator Tomcat Cache Hits/Sec | Rate | Number of cache hits per second in tomcat container. |
| Actuator Tomcat Cache Access/Sec | Rate | Number of times that the tomcat cache was accessed per second in tomcat container. |
| Actuator Tomcat Global Errors | sample | Number of request error occurred in tomcat container.. |
| Actuator Tomcat Busy Threads | sample | Number of busy threads on the tomcat container. |
| Actuator Tomcat Current Threads | sample | Number of current threads on the tomcat container. |
| Actuator Tomcat Average Response Time (Sec) | sample | Tomcat average response time in seconds. |
Spring Boot Spectator Stats
| Metric | Type | Description |
|---|---|---|
| Response Time (Sec) | sample | Service response time in seconds |
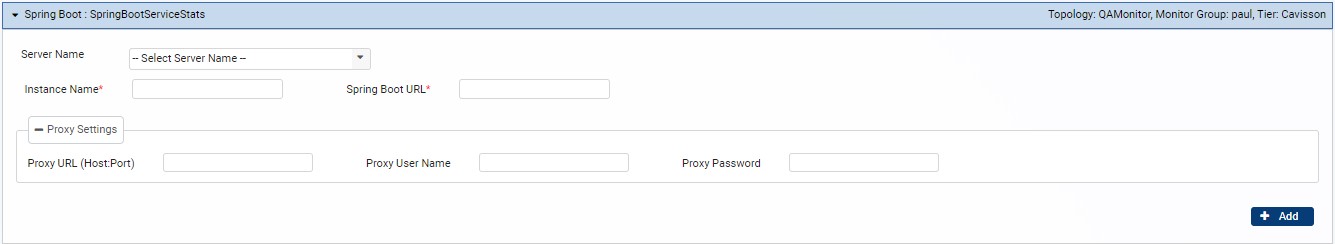
Monitor UI