Oracle DB Monitoring
Overview
The Oracle Database is an object-relational database management system. The Oracle Database monitor captures performance metrics from Oracle databases (version 10g or later).

It retrieves metrics from the data dictionary and groups them in four categories:
•Activity: It provide data of throughput of transactions, SQL executes, I/O reads and writes, average active sessions, etc.
•Resource Utilization: What database resources are currently in use (sessions, open cursors, shared pool, etc.).
•Efficiency: Ratios and response times as indicators of the instance’s efficiency.
•WaitClass Breakdown: Every wait event belongs to a class of wait event.
Oracle DB Metrics
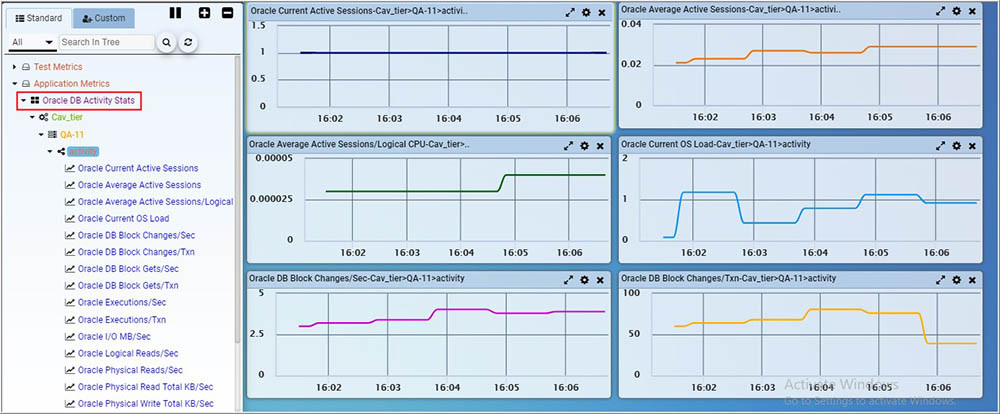
Oracle DB Activity Stats
| Graph Name | Data Type | Description |
|---|---|---|
| Oracle Current Active Sessions | Rate | Number of active sessions. |
| Oracle Average Active Sessions | Rate | Average number of active sessions. |
| Oracle Average Active Sessions/ logical CPU | Rate | This shows the average load the database imposes on each logical CPU (i.e. cores or hyperthreads). |
| Oracle Current OS Load | Rate | Host CPU load. |
| Oracle DB Block Changes/Sec | Rate | Database blocks changed in the buffer cache. |
| Oracle DB Block Changes/Txn | Rate | Database blocks changed in the buffer cache per SQL transaction. |
| Oracle DB Block Gets /Sec | Rate | Database blocks read from the buffer cache. |
| Oracle DB Block Gets/ Txn | Rate | Database blocks read from the buffer cache per SQL transaction. |
| Oracle Executions/Sec | Rate | SQL executions per second |
| Oracle Executions/Txn | Rate | SQL executions per SQL transaction. |
| Oracle I/O MB/Sec | Rate | I/O Megabytes per Second. |
| Oracle Logical Reads/Sec | Rate | Logical Reads Per Second |
| Oracle Physical Reads/Sec | Rate | Physical Reads Per Second |
| Oracle Physical Read Total Bytes/Sec | Rate | Physical read total bytes per second |
| Oracle Physical Write Total Bytes/Sec | Rate | Physical write total bytes per second |
| Oracle User Calls/Sec | Rate | User calls per second. |
| Oracle User Calls/Txn | Rate | User calls per transaction. |
| Oracle User Commits/Sec | Rate | User commits per Second. |
| Oracle User Rollbacks/Sec | Rate | User rollbacks per Second. |
| Oracle GC CR Block Received/Sec | Rate | GC CR block received per second. |
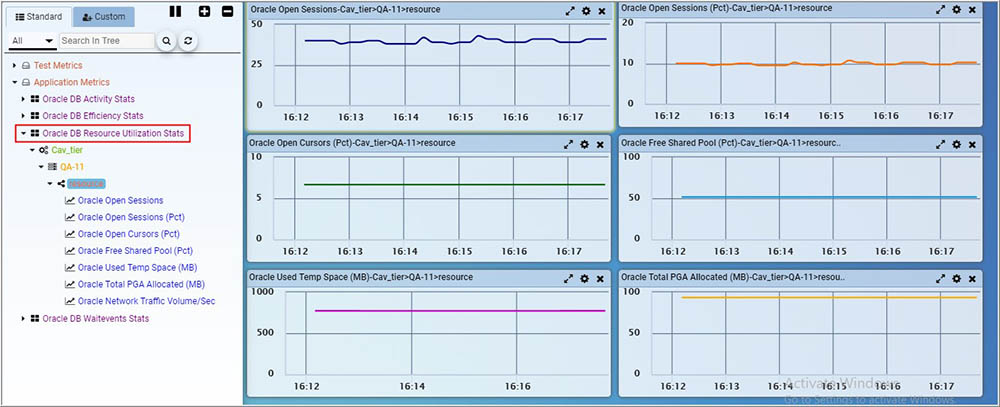
Oracle DB Resource Utilization Stats
| Graph Name | Data Type | Description |
|---|---|---|
| Oracle Open Sessions | Sample | Number of all database open sessions. |
| Oracle Open Sessions (Pct) | Sample | It shows open sessions vs. DB parameter sessions in percentage. |
| Oracle Open Cursors (Pct) | Sample | It shows open cursors in a session vs. DB parameter open_cursors in percentage. |
| Oracle Free Shared Pool (Pct) | Sample | Free Shared Pool in percentage |
| Oracle UsedTemp Space (MB) | Sample | Used temporary tablespace in Megabytes. |
| Oracle Total PGA Allocated (MB) | Sample | RAM used for sorts, hashes and other operation in Megabytes. |
| Oracle Network Traffic Volume/Sec | Rate | Network traffic volume per second. |
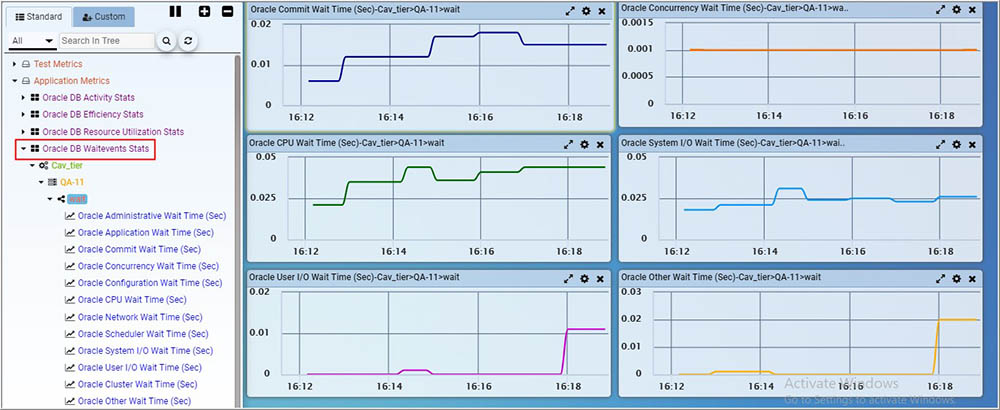
Oracle DB Waitevents Stats
| Graph Name | Data Type | Description |
|---|---|---|
| Oracle Administrative Wait Time (Sec) | Rate | Time waited in Administrative wait class in last minute. |
| Oracle Application Wait Time (Sec) | Rate | Time waited in Application wait class in last minute. |
| Oracle Commit Wait Time (Sec) | Rate | Time waited in Commit wait class in last minute. |
| Oracle Concurrency Wait Time (Sec) | Rate | Time waited in Concurrency wait class in last minute. |
| Oracle Configuration Wait Time (Sec) | Rate | Time waited in Configuration wait class in last minute. |
| Oracle CPU Wait Time (Sec) | Rate | Time waited in CPU wait class in last minute. |
| Oracle Network Wait Time (Sec) | Rate | Time waited in Network wait class in last minute. |
| Oracle Scheduler Wait Time (Sec) | Rate | Time waited in Scheduler wait class in last minute. |
| Oracle System I/O Wait Time (Sec) | Rate | Time waited in System I/O wait class in last minute. |
| Oracle User I/O Wait Time (Sec) | Rate | Time waited in User I/O wait class in last minute. |
| Oracle Cluster Wait Time (Sec) | Rate | Time waited in Cluster wait class in last minute. |
| Oracle Other Wait Time (Sec) | Rate | Time waited in Other wait class in last minute. |
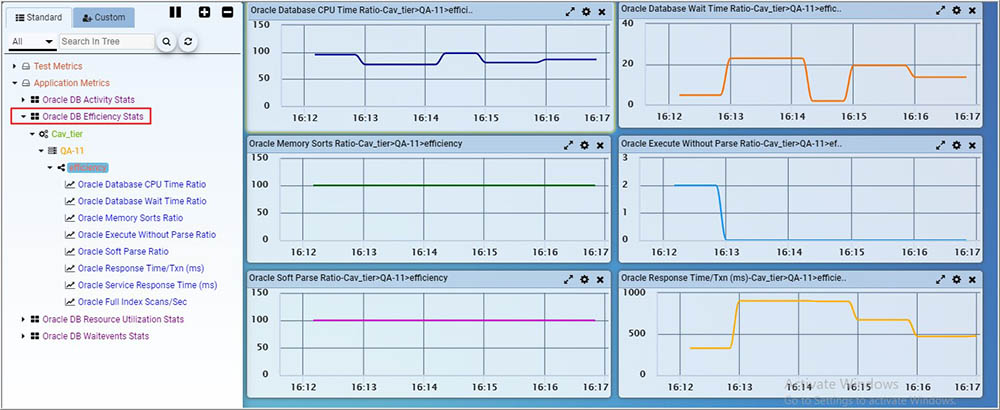
Oracle DB Efficiency Stats
| Graph Name | Data Type | Description |
|---|---|---|
| Oracle Database CPU Time Ratio | Sample | Percentage of CPU time against database time. |
| Oracle Database Wait Time Ratio | Sample | Complementary to “Database CPU Time Ratio” (% of non-CPU waits). |
| Oracle Memory Sorts Ratio | Sample | Percentage of sort operations that were done in RAM (as opposed to disk). |
| Oracle Execute Without Parse Ratio | Sample | Percentage of (soft and hard) parsed SQL against all executed SQL. |
| Oracle Soft Parse Ratio | Sample | Ratio of soft parses to hard parses. |
| Oracle Response Time /Txn (ms) | Sample | Response time per transaction in millisecond. |
| Oracle Service Response Time (ms) | Sample | SQL service response time (ms) in millisecond. |
| Oracle Full Index Scans/Sec | Rate | Full index scans per second. |