MySQL Monitoring
Overview
MySQL is the most popular Open Source Relational SQL database management system. MySQL is one of the best RDBMS being used for developing web-based software applications.
For monitoring, MySQL server, user needs to provide following credentials:
- Host or IP (where MySQL server is running)
- Port
- User Name
- Password
For enabling SSL in MySQL Monitor, user needs to provide -s option as monitor arguments. This will make connection to MySQL server through SSL.
This page provides MySQL monitoring capabilities supported by Cavisson.
MySQL Replication
MySQL replication is a process that allows you to maintain easily multiple copies of a MySQL data by having them copied automatically from a master to a slave database. This can helpful for many reasons including facilitate a backup for the data, a way to analyze it without using the main database, or simply as a means to scale out. Replication enables data from one MySQL database server (the master) to be copied to one or more MySQL database servers (the slaves). Replication is asynchronous by default; slaves do not need to be connected permanently to receive updates from the master. Depending on the configuration, you can replicate all databases, selected databases, or even selected tables within a database.
Advantages of replication in MySQL:
- Scale-out Solutions: Spreading the load among multiple slaves to improve performance. In this environment, all writes and updates must take place on the master server. Reads, however, may take place on one or more slaves. This model can improve the performance of writes (since the master is dedicated to updates), while dramatically increasing read speed across an increasing number of slaves.
- Data security: Because data is replicated to the slave, and the slave can pause the replication process, it is possible to run backup services on the slave without corrupting the corresponding master data.
- Analytics: Live data can be created on the master, while the analysis of the information can take place on the slave without affecting the performance of the master.
- Long-distance Data Distribution: You can use replication to create a local copy of data for a remote site to use, without permanent access to the master.
MySQL Replication Metrics
Cavisson MySQL monitoring supports following metrics (for slave only):
| Metrics Name | Description |
|---|---|
| Slave_IO_State | The current state of the slave. |
| Slave_IO_Running | Whether the I/O thread for reading the master’s binary log is running. |
| Slave_SQL_Running | Whether the SQL thread for executing events in the relay log is running |
| Slave_SQL_Running | Whether the SQL thread for executing events in the relay log is running |
| Relay_Log_Space | The total combined size of all existing relay log files. |
| SQL_Delay | The number of seconds that the slave must lag the master. |
| SQL_Remaining_Delay | When Slave_SQL_Running_State is Waiting until MASTER_DELAY seconds after master executed event, this field contains the number of delay seconds remaining |
| Slave_SQL_Running_State | The state of the SQL thread |
| Master_Retry_Count | The number of times the slave can attempt to reconnect to the master in the event of a lost connection. |
MySQL Metrics
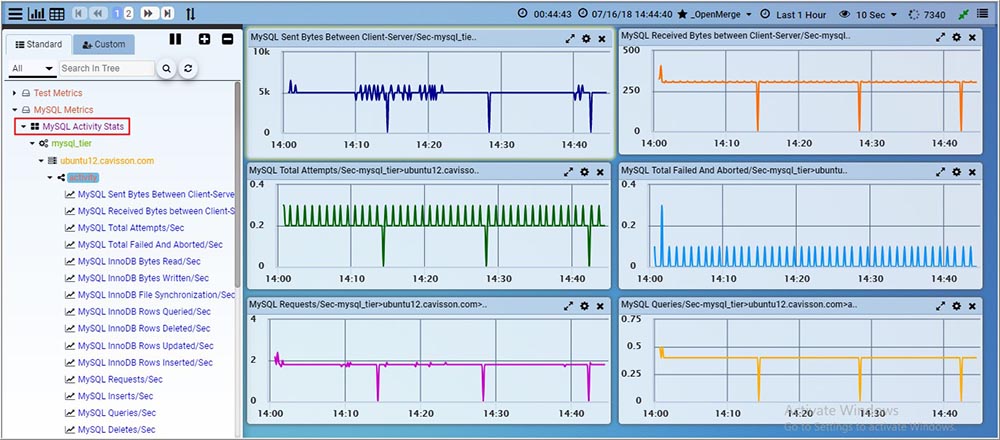
MySQL Activity Stats
MySQL Activity monitors metrics related to MySQL operations, transactions, InnoDB operations etc.
| Graph Name | Type | Description |
|---|---|---|
| MySQL Sent Bytes Between Client-Server/Sec | Rate | Number of bytes sent to all clients per second. |
| MySQL Received Bytes between Client-Server/Sec | Rate | Number of bytes received from all clients per second. |
| MySQL Total Attempts/Sec | Rate | Number of connection attempts (successful or not) per second to the MySQL server. |
| MySQL Total Failed And Aborted/Sec | Rate | Number of aborted or failed connections, aborted because the client died without closing the connection properly or failed attempts to connect to MySQL. |
| MySQL InnoDB Bytes Read/Sec | Rate | The amount of data read per second in Bytes. |
| MySQL InnoDB Bytes Written/Sec | Rate | The amount of data write per second in Bytes. |
| MySQL InnoDB File Synchronization/Sec | Rate | Number of file Synchronization operation called per second. |
| MySQL InnoDB Rows Queried/Sec | Rate | Number of rows read per second from InnoDB tables. |
| MySQL InnoDB Rows Deleted/Sec | Rate | Number of rows deleted per second from InnoDB tables. |
| MySQL InnoDB Rows Updated/Sec | Rate | Number of rows updated per second from InnoDB tables. |
| MySQL InnoDB Rows Inserted/Sec | Rate | Number of rows inserted per second from InnoDB tables. |
| MySQL Requests/Sec | Rate | The number of statements executed per second by the server. This includes only statements sent to the server by clients. |
| MySQL Inserts/Sec | Rate | Number of insert and replace statements executed per second by the server. |
| MySQL Queries/Sec | Rate | Number of queries per second by the server from select command and from cache. |
| MySQL Deletes/Sec | Rate | Number of delete statements executed per second by the server. |
| MySQL Updates/Sec | Rate | Number of delete statements executed per second by the server. |
| MySQL Tables Opened/Sec | Rate | Number of tables the server has opened per second by the server. |
| MySQL Temporary Tables Created /Sec | Rate | The number of internal on-disk temporary tables created per second by the server while executing statements. |
| MySQL Transactions/Sec | Rate | Number of total transactions per second. |
| MySQL Rolled Back Transactions/Sec | Rate | Number of roll back transactions per second. |
| MySQL Committed Transactions/Sec | Rate | Number of committed transactions per second. |
| MySQL Total Sort/sec | Rate | The number of sorts per second, done by scanning the table and using ranges. |
MySQL Efficiency Stats
MySQL Efficiency monitors metrics related to key cache, query cache, InnoDB cache etc.
| Graph Name | Type | Description |
|---|---|---|
| MySQL Slow Queries (Pct) | Sample | Percentage of queries that have taken more than long_query_time. |
| MySQL Key Cache Read Hits/Sec | Rate | The number of physical reads per second of a key block from disk into the MyISAM key cache. |
| MySQL Key Cache Write Hits/Sec | Rate | The number of physical writes per second of a key block from disk into the MyISAM key cache. |
| MySQL Query Cache Hits (Pct) | Sample | Percentage of query cache hits. |
| MySQL InnoDB Cache Buffer Pool Hits/Sec | Rate | Number of logical reads per second from the buffer pool. |
| MySQL InnoDB Cache Buffer Pool Writes Waited (Pct) | Sample | Percentage of InnoDB buffer Pool waiting request to write. |
| MySQL InnoDB Row Locks Waiting | Sample | Number of row locks currently being waited for by operations on InnoDB tables. |
| MySQL InnoDB Row Locks Avg Lock Time (Sec) | Sample | Average time to acquire a row lock for InnoDB tables, in seconds. |
| MySQL Table Locks Waited (Pct) | Sample | Percentage of request for a table lock that could not be granted immediately and a wait was needed. |

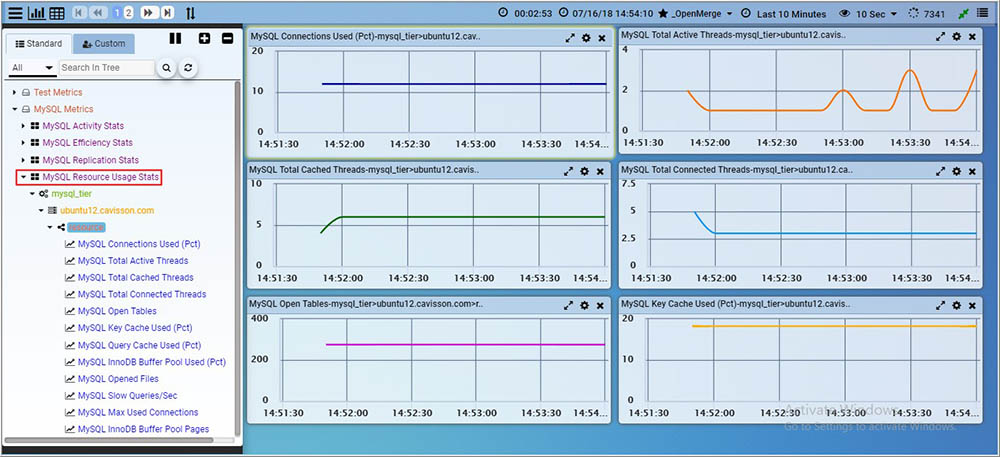
MySQL Resource Usage Stats
MySQL Resource Usage Stats monitors metrics related to resource consumption of MySQL.
| Graph Name | Type | Description |
|---|---|---|
| MySQL Connections Used (Pct) | Sample | Percentage of used connections from total connections. |
| MySQL Total Active Threads | Sample | Number of threads that are not sleeping. |
| MySQL Total Cached Threads | Sample | Number of threads in the thread cache. |
| MySQL Total Connected Threads | Sample | Number of currently open connections. |
| MySQL Open Tables| | Sample | Number of tables that are open. |
| MySQL Key Cache Used (Pct) | Sample | Percentage of used key cache. |
| MySQL Query Cache Used (Pct) | Sample | Percentage of used query cache. |
| MySQL InnoDB Buffer Pool Used (Pct) | Sample | Percentage of used InnoDB Buffer Pool |
| MySQL Opened Files | Sample | Number of opened files |
| MySQL Slow Queries/Sec | Rate | The number of queries per second that have taken more than long_query_time second(s) |
| MySQL Max Used Connections | Sample | The maximum number of connections that have been in use simultaneously since the server started. |
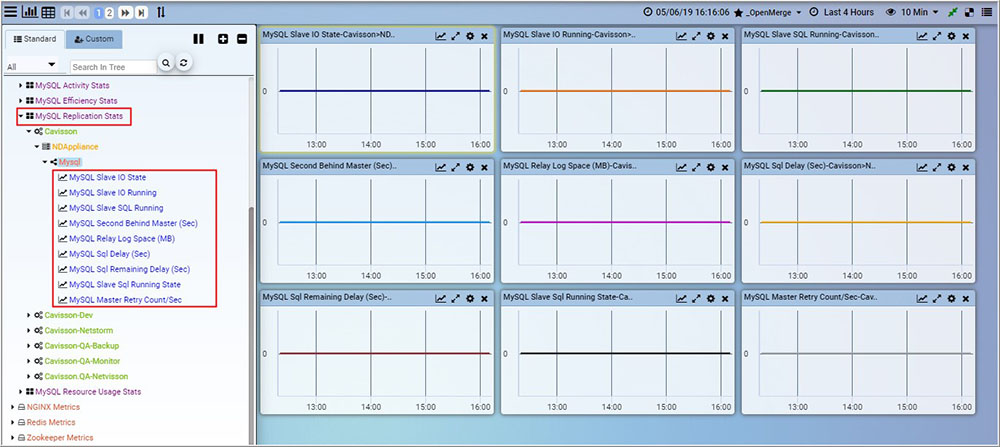
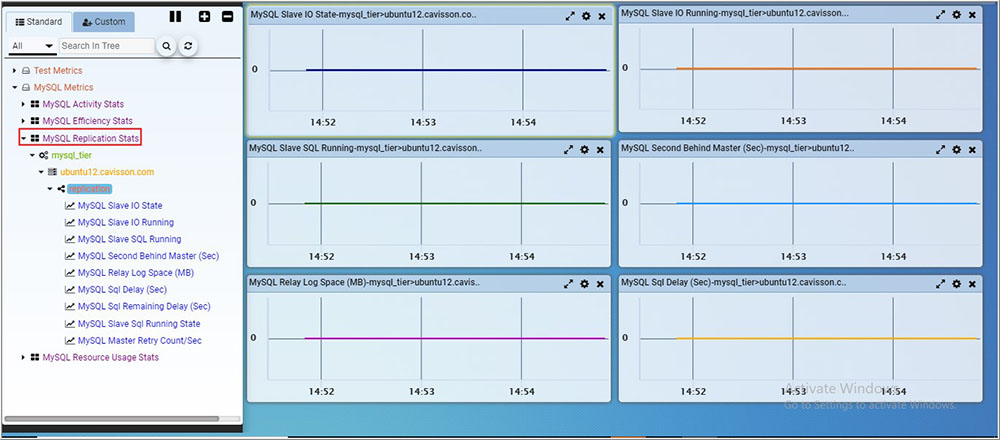
MySQL Replication Stats
MySQL Replication monitors metrics related to slave IO state, slave IO running etc.
| Graph Name | Type | Description |
|---|---|---|
| MySQL Slave IO State | Sample | The current status of the slave. Slave IO state is 1 = Checking master version, 2 = Connecting to master, 3 = Queueing master event to the relay log, 4 = Reconnecting after a failed binlog dump request, 5 = Reconnecting after a failed master event read, 6 = Registering slave on master, 7 = Requesting binlog dump, 8 = Waiting for its turn to commit, 9 = Waiting for master to send event, 10 = Waiting for master update, 11 = Waiting for slave mutex on exit, 12 = Waiting for the slave SQL thread to free enough relay log space, 13 = Waiting to reconnect after a failed binlog dump request, 14 = Waiting to reconnect after a failed master event read. |
| MySQL Slave IO Running | Sample | Whether the I/O thread for reading the master’s binary log is running. Slave IO running is 0 = No, 1 = yes, 2 = Connecting. |
| MySQL Slave SQL Running | Sample | Whether the SQL thread for executing events in the relay log is running. Slave Sql running is 0 = No, 1 = yes. |
| MySQL Second Behind Master (Sec) | Sample | The number of seconds that the slave SQL thread is behind processing the master binary log. |
| Relay_Log_Space | Sample | The total combined size of all existing relay log files. |
| SQL_Delay | Sample | The number of seconds that the slave must lag the master. |
| SQL_Remaining_Delay | Sample | When Slave SQL Running State is Waiting until MASTER DELAY seconds after master executed event, It contains the number of delay seconds remaining. |
| Slave_SQL_Running_State | Sample | The state of the SQL thread. Slave Sql Running state is 1 = Killing slave, 2 = Making temporary file (append) before replaying LOAD DATA INFILE, 3 = Making temporary file (create) before replaying LOAD DATA INFILE, 4 = Reading event from the relay log, 5 = Slave has read all relay log; waiting for more updates, 6 = Waiting for an event from Coordinator, 7 = Waiting for slave mutex on exit, 8 = Waiting for Slave Workers to free pending events, 9 = Waiting for the next event in relay log, 10 = Waiting until MASTER_DELAY seconds after master executed event. |
| Master_Retry_Count | Sample | The number of times the slave can attempt to reconnect to the master in the event of a lost connection. |
MySQL Group Replication
MySQL Group Replication provides virtually synchronous updates on any member in a group of MySQL servers, with conflict handling and automatic group membership management and failure detection. The multi master plugin for MySQL is here. MySQL Group Replication provides virtually synchronous updates on any member in a group of MySQL servers, with conflict handling and automatic group membership management and failure detection.
| Graph Name | Graph Type | Description |
|---|---|---|
| MySQL Member State | Scalar | State OFFLINE=0 The Group Replication plugin is installed but has not been started, ONLINE=1 The member is in a fully functioning state, RECOVERING=2 The member has joined a group from which it is retrieving data, ERROR=3 Whenever there is an error on the recovery phase or while applying changes, the server enters this state, UNREACHABLE=4 Whenever the local failure detector suspects that a given server is not reachable, because maybe it has crashed or was disconnected involuntarily, it shows that server state as unreachable. |
| MySQL In Queue Transactions | Scalar | Number of transactions in queue pending certification. In case of simple run this field shows value 0 but if the load is high it increases transactions in queue. Once the transactions have been checked for conflicts, if they pass the check, they are queued to be applied as well. |
| MySQL Checked Transactions/Sec | Scalar | Number of transactions that have been checked for conflicts per second. |
| MySQL Conflict Detected Transactions/Sec | Scalar | Number of transactions that did not pass the conflict detection check per second. |
| MySQL Row Validated Transactions | Scalar | Current size of the conflict detection database (against which each transaction is certified). |