Kubernetes Monitoring
Overview
Kubernetes is a portable, extensible open-source platform for managing containerized workloads and services that facilitates both declarative configuration and automation. It has a large, rapidly growing ecosystem. Kubernetes services, support, and tools are widely available.
Key Features:
- Application Performance Management (APM) solution for Kubernetes Cluster
- Monitoring all components of Kubernetes cluster including Node, Pod & Containers
- CPU, Memory, & Disk I/O monitoring for Containers & host
- Network Throughput Monitoring for each pod & host
- JMX based Monitoring for Java application running in containers
- Provides simple and intuitive view of live application traffic
- Allow users to identify bottlenecks and the areas where they exist
- ND powerful agent engine
- Covers all popular programming languages (NodeJS, Java, .Net) and enterprise platforms,
- Provides deep diagnostics of application at class, method, DB Queries, Hotspots etc.
- Correlates performance metrics captured by different sources to build a holistic view
- ND’s unmatched APM platform
- Provides complete visibility of distributed applications with auto-discovered end-to-end business transactions,
- Dynamically alert baseline performance,
- Quickly isolate and resolve production issues, and
- Enhance development & ops collaboration
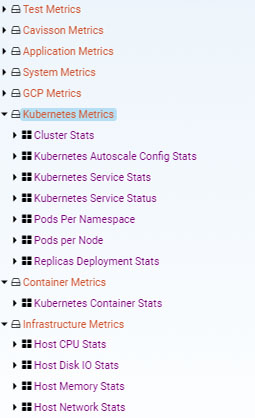
Kubernetes Metrics
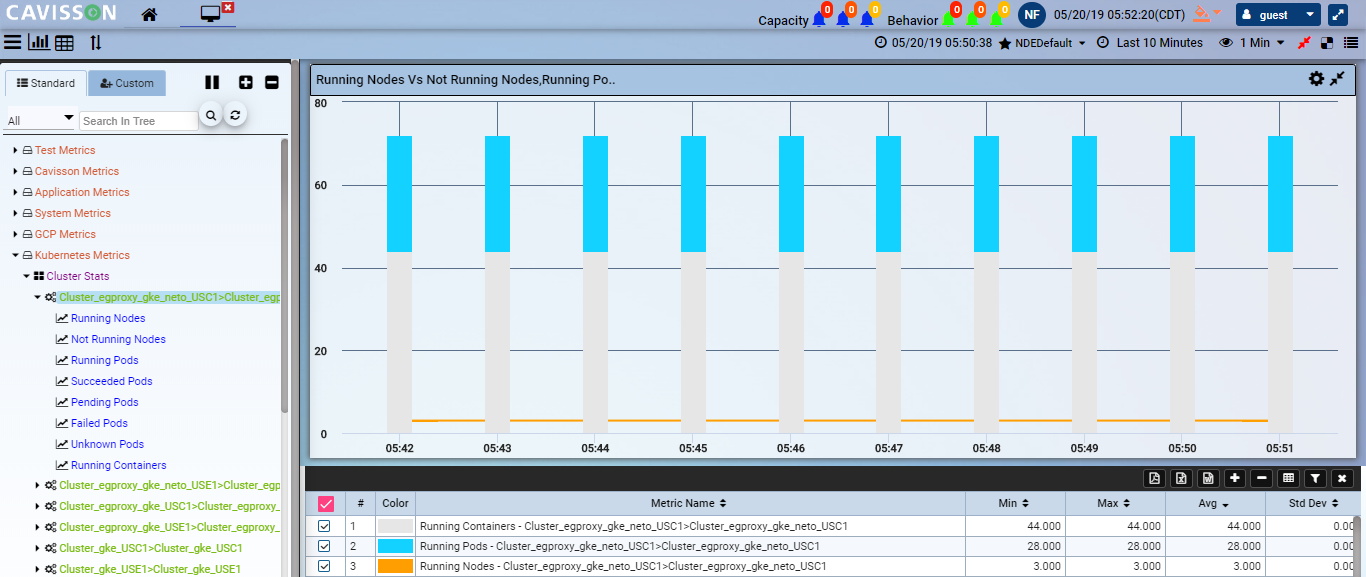
- Cluster Stats – Running Nodes, Not Running Nodes, Running Pods, Succeeded Pods, Pending Pods, Failed Pods, Unknown Pods, Running Containers.
- Kubernetes Autoscale Config Stats – Minimum Replicas, Maximum Replicas, Target CPU Utilization, Last Scale Time, Current Replicas, Desired Replicas, Current CPU Utilization.
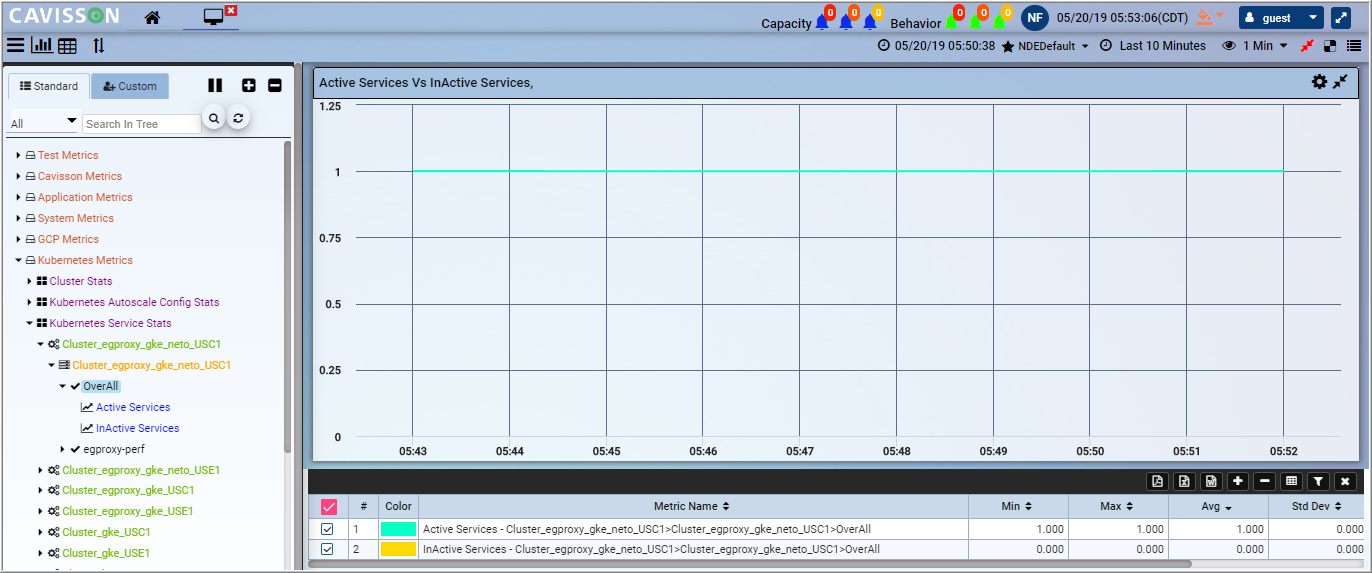
- Kubernetes Service Stats – Service Status, Active Services, Inactive services
- Kubernetes Service Status – Kubernetes Service Status
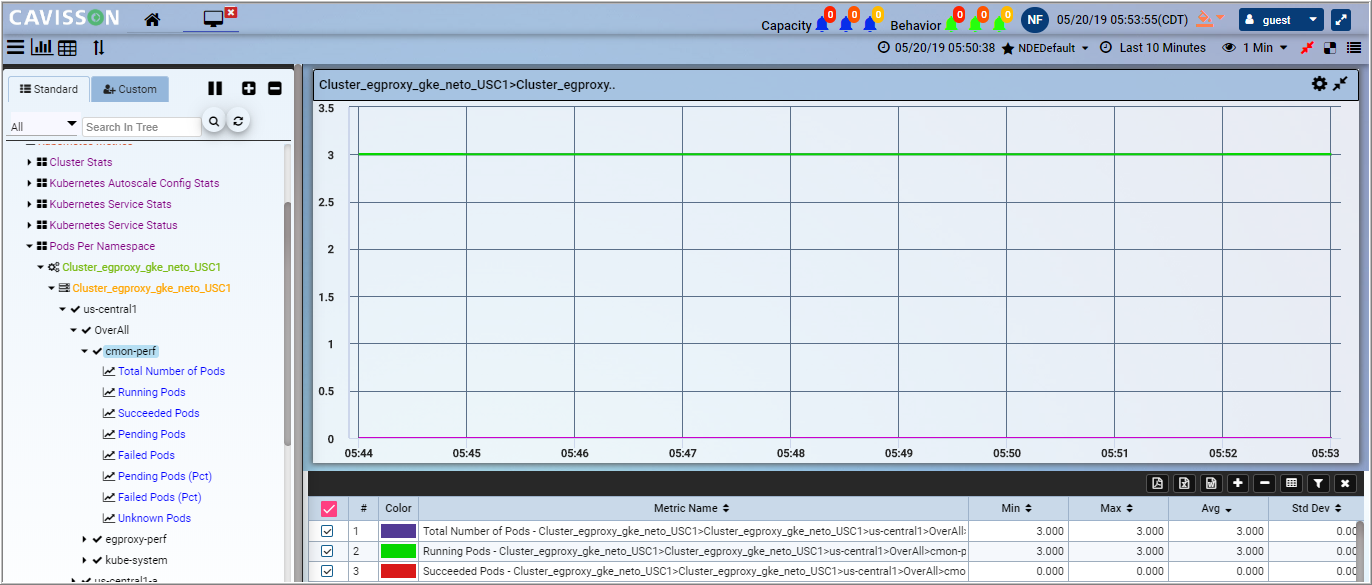
- Pods per Namespace – Total number of Pods, Running Pods, Succeeded Pods, Pending Pods, Failed Pods.
- Pods per Node – Total number of Pods, Running Pods, Succeeded Pods, Pending Pods, Failed Pods.
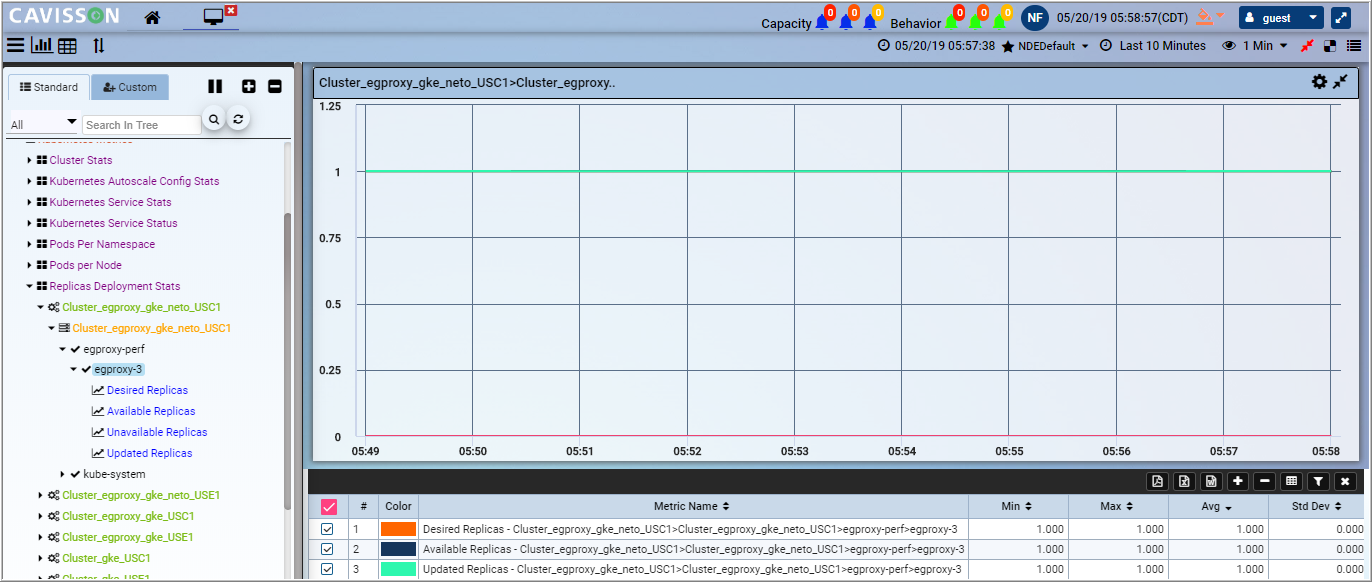
- Replicas Deployment Stats – Desired Replicas, Available Replicas, Unavailable Replicas, Updated Replicas
Cluster Stats
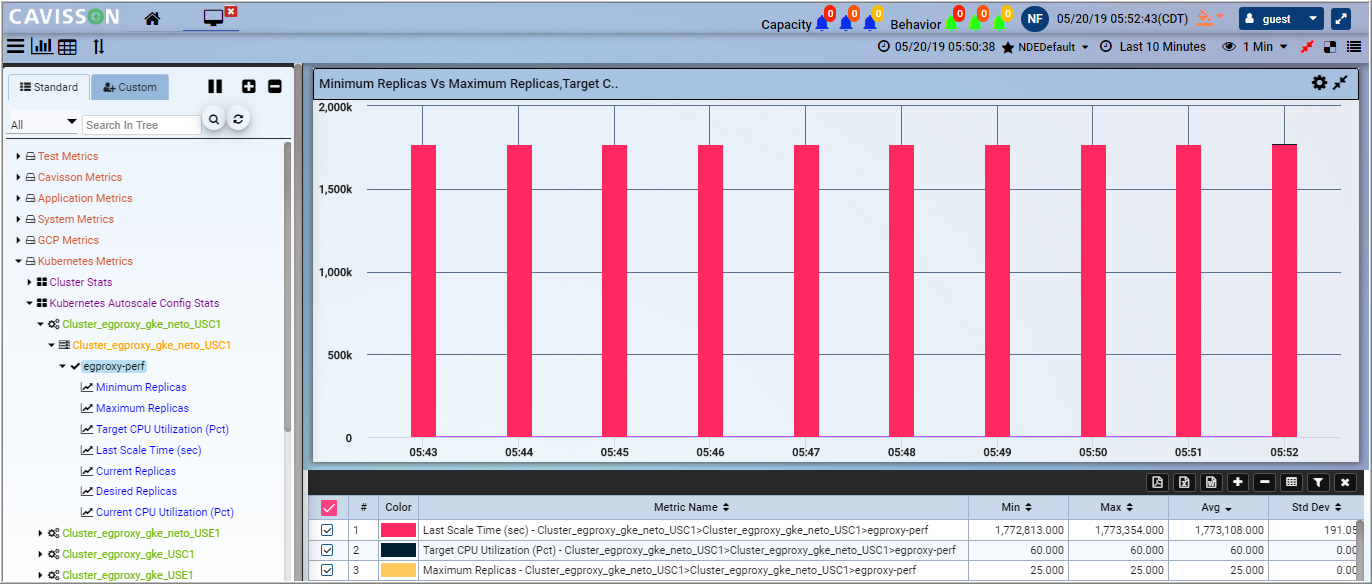
Kubernetes Autoscale Config Stats
Kubernetes Service Stats
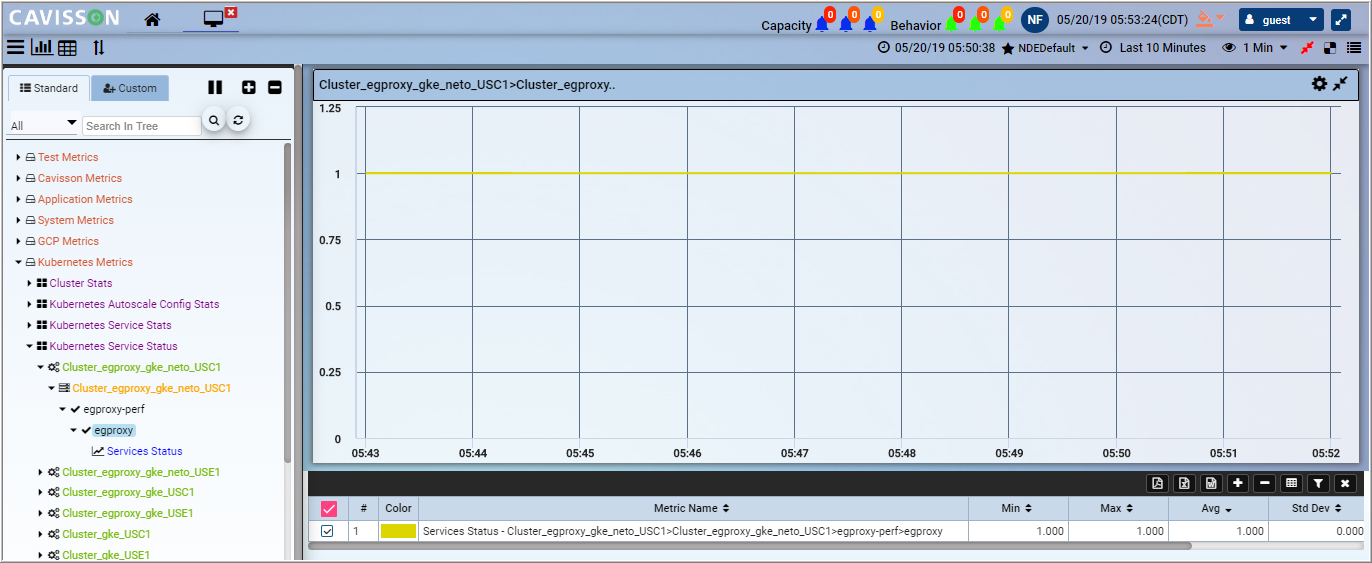
Kubernetes Service Status
Pods Per Namespace

Pods Per Node
Replicas Deployment Stats
Container Metrics
- Kubernetes Container Stats – User CPU Time/Sec, System CPU Time/Sec, Total CPU Time / Sec, Throttled Count/Sec, Throttled Time (Sec), Cache Memory Size (MB), Resident Set Size, Used Memory (MB), Mapped File Size (MB), Page Ins/Sec, Page Outs/Sec, Page Faults/Sec, Disk Read Size (MB/Sec), Disk Write Size (MB/Sec), Disk Reads/Sec
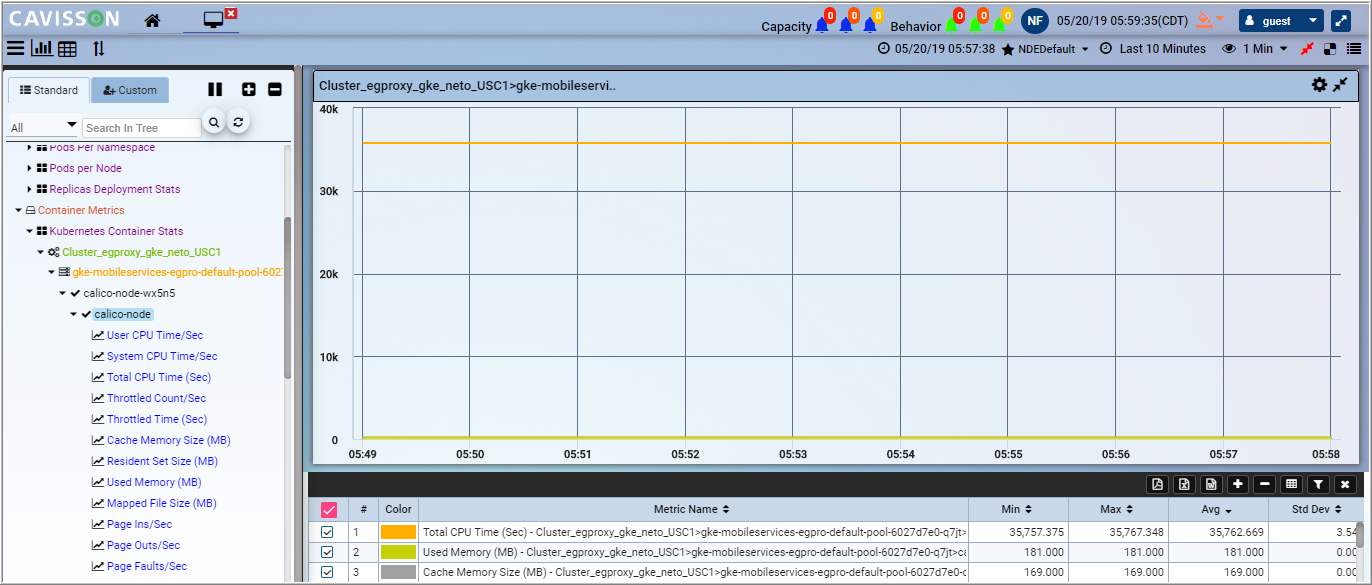
Kubernetes Container Stats
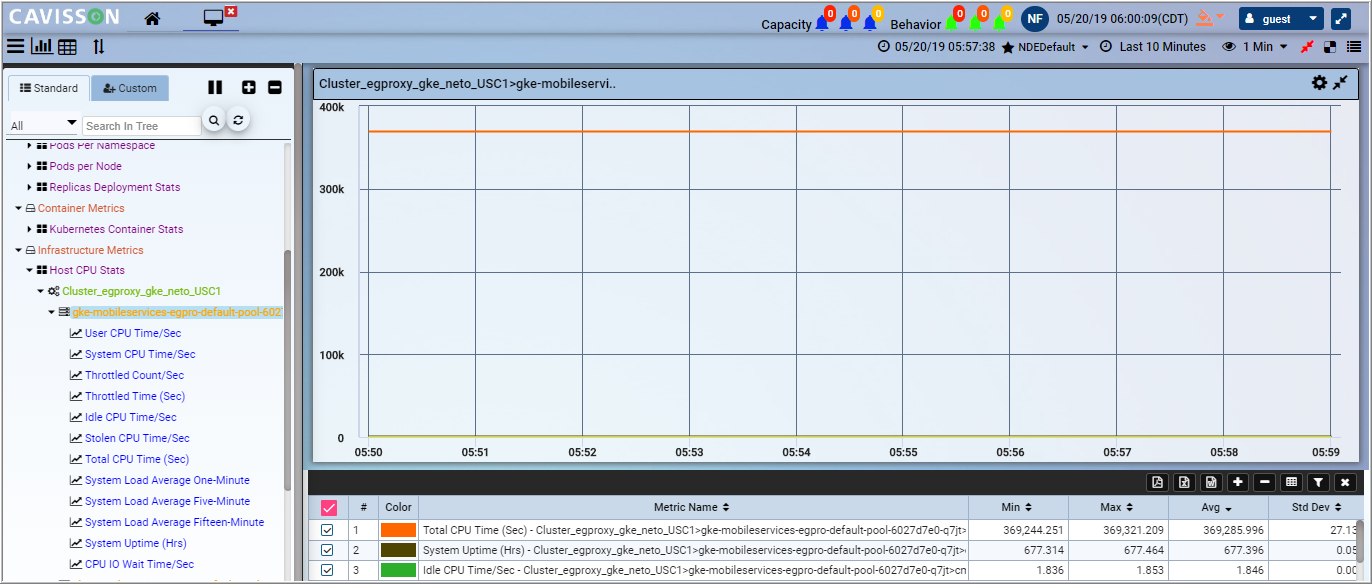
Infrastructure Metrics
- Host CPU Stats – User CPU Time/Sec, System CPU Time/Sec, Throttled Count/Sec, Throttled Time (Sec), Idle CPU Time/Sec, Stolen CPU Time/Sec, total CPU Time/Sec, System Load Average One Minute, System Load Average Five Minute, System Load Average Fifteen Minute, System Uptime, CPU IO Wait Time/Sec.
- Host Disk IO Stats – Disk Read Size (MB/Sec), Disk Write Size (MB/Sec), Disk Reads/Sec, Disk Writes/Sec, Total Data Read from Disk (MB), total Data written to Disk (MB)
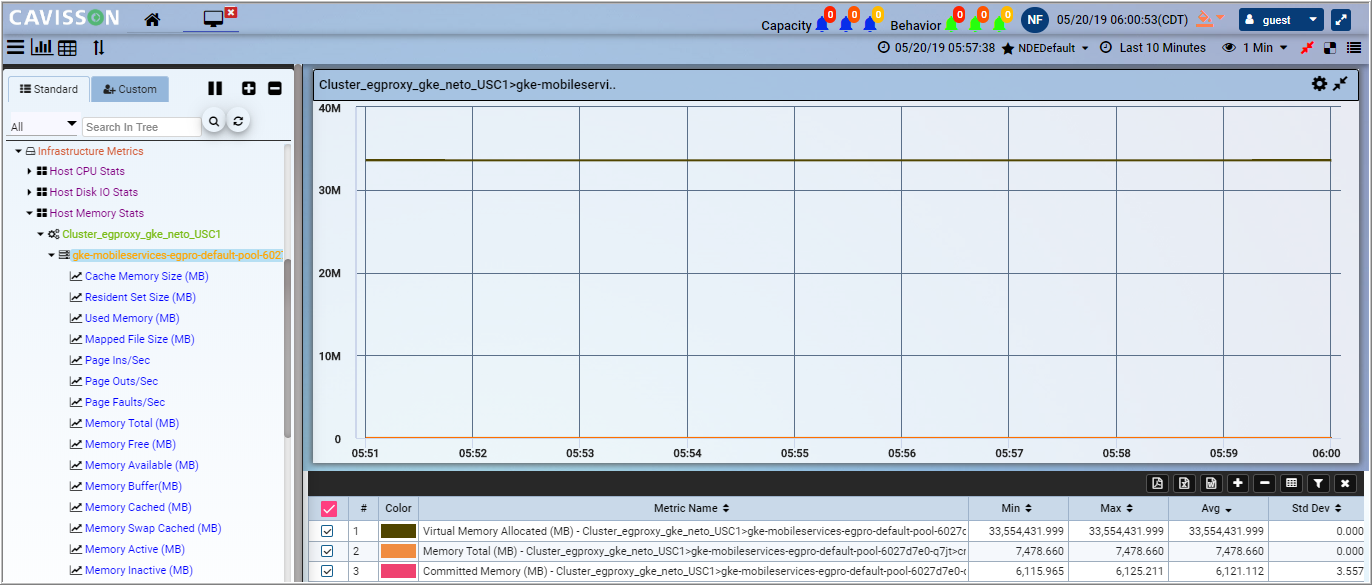
- Host Memory Stats – Cache Memory Size (MB), Resident Set Size (MB), Used Memory (MB), Mapped File Size (MB), Page Ins/Sec, Page Outs/Sec, Page Faults/Sec, Memory Total/Free/Available, Memory Buffer (MB), Memory Cached (MB), Memory Swapped Cached (MB), Memory Active (MB), Memory Inactive (MB), Swap Total (MB), Swap Free (MB), Dirty Memory (MB).
- Host Network Stats – Virtual Memory Allocated (MB), Memory Total (MB), Committed Memory (MB), Used Memory (MB), Memory Available (MB)
Host CPU Stats
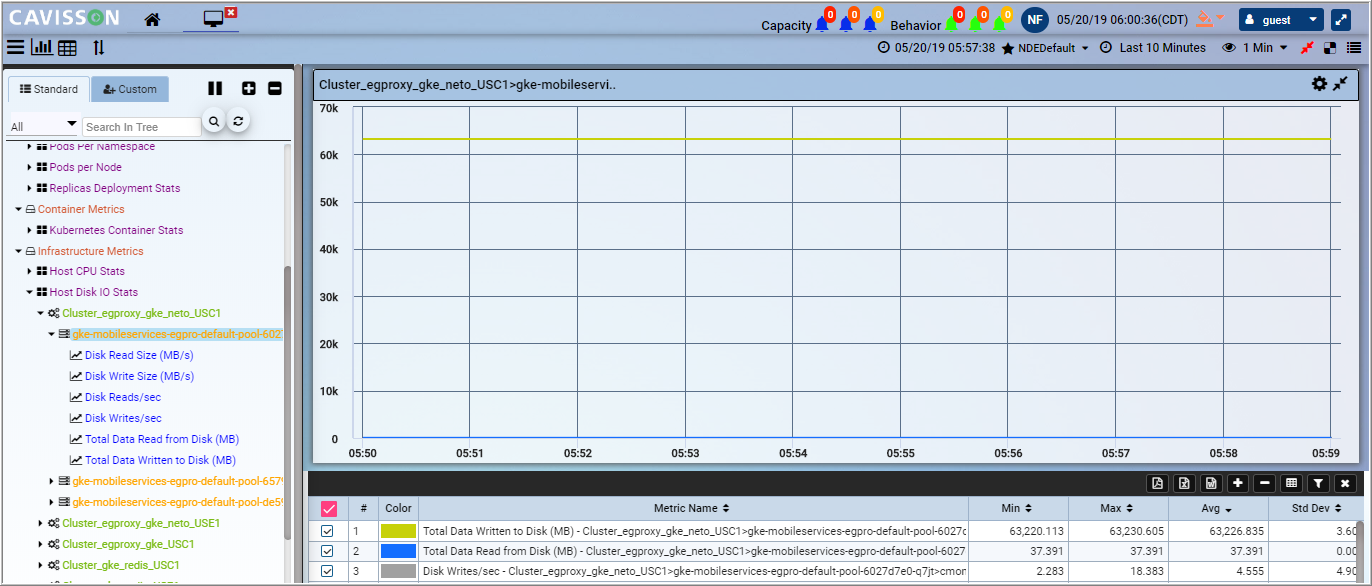
Host Disk IO Stats
Host Memory Stats
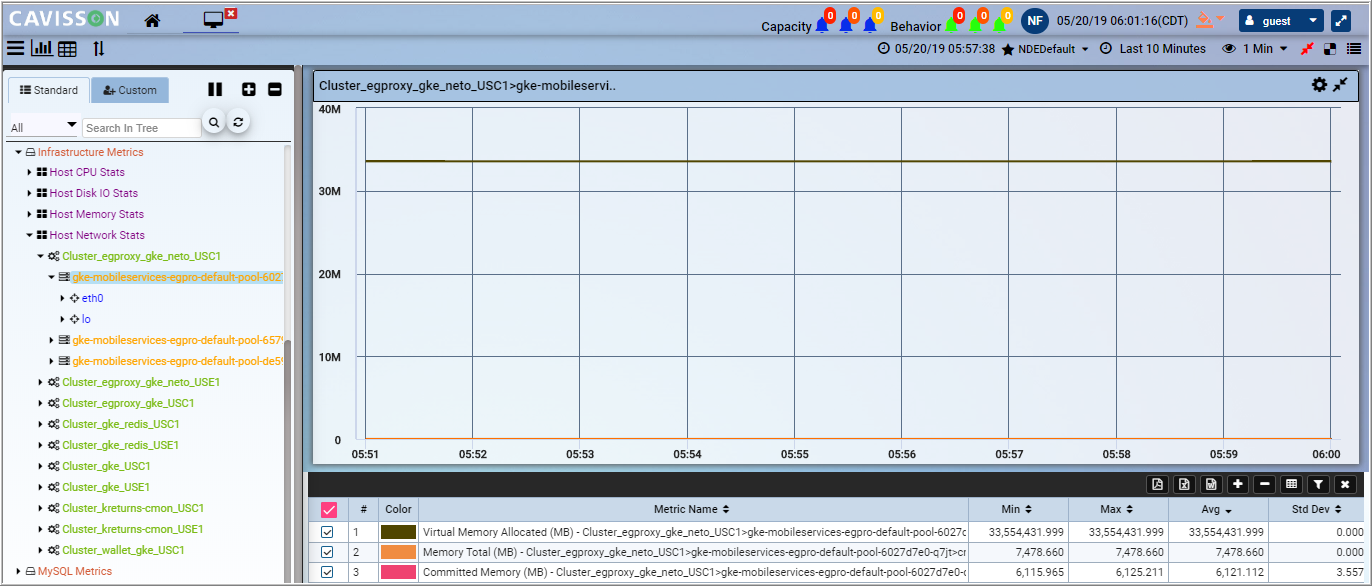
Host Network Stats
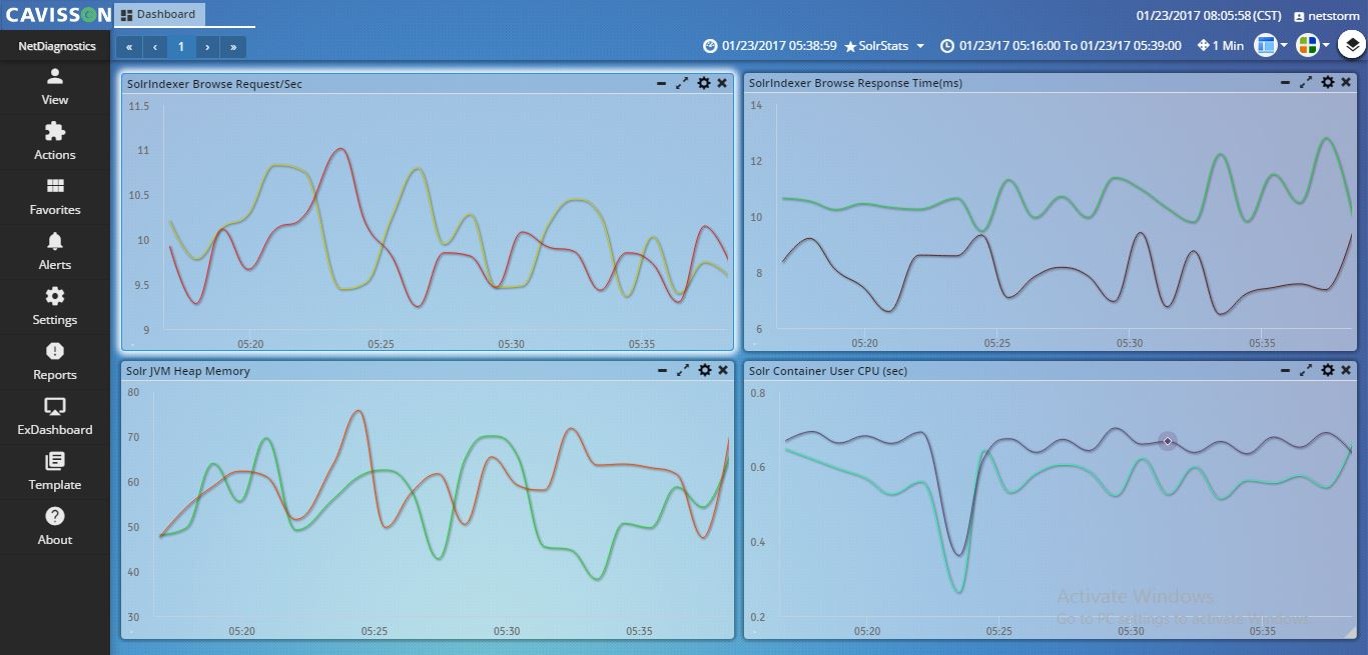
Kubernetes – Solr Stats
Cavisson ND captures below metrics for Kubernetes Solr Stats:
- SolrIndexerer Browse Request/Sec
- SolrIndexerer Browse Response Time (milliseconds)
- Solr JVM Heap Memory
- Solr Container User CPU (sec)
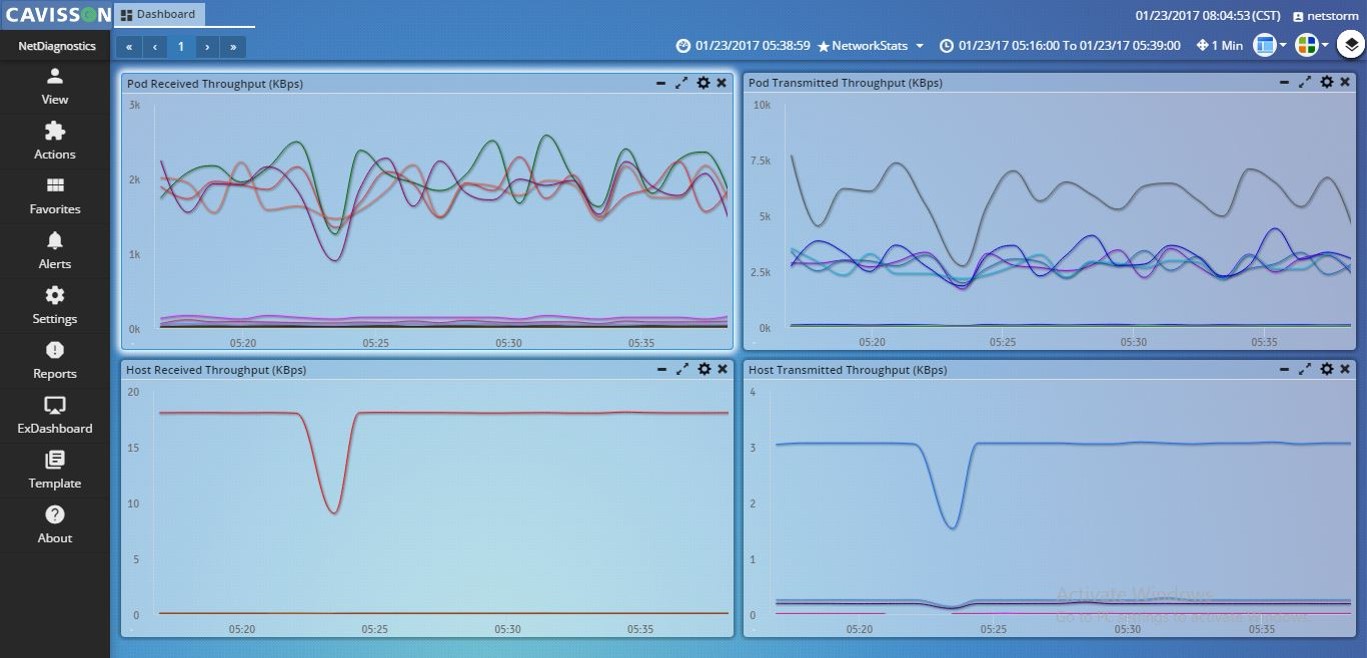
Kubernetes – Network Stats
Cavisson ND captures below metrics for Kubernetes Network Stats:
- POD Received Throughput (KBps)
- POD Transmitted Throughput (KBps)
- Host Received Throughput (KBps)
- Host Transmitted Throughput (KBps)