GCP Monitoring
Overview
A common framework for executing Google Cloud Platform (GCP) monitors is implemented and is used by Cavisson Application Agent. This framework is responsible for capturing and sending attributes of one or more GCP as per configuration of monitor.
GCP Monitoring
AgentCPULoadStats
| Metric | Metric Description |
|---|---|
| Load Average Over 1 Minute | Average load of system during each minute |
| Load Average Over 5 Minutes | Average load of system during 5 minute |
| Load Average Over 15 Minutes | Average load of system during 15 minute |
AgentCPUUsageStats
| Metric | Metric Description |
|---|---|
| CPU Usage (Pct) | CPU usage in percentage |
AgentDiskStats
| Metric | Metric Description |
|---|---|
| Disk Bytes Used (MB) | Disk bytes used in megabytes, where type of usage (free, used, and reserved) in device |
| Average I/O Time (ms)/Sec | Average time in millisecond an I/O-operation took to complete in device per second |
| Merged Operations/Sec | Number of merged operations per second, where direction (read and write) in device |
| Operations/Sec | Number of disk operations per second, where direction (read and write) in device |
| Operation Time (ms)/Sec | Total time in millisecond spent In disk operations (read and write) in device per second |
| Average Pending Operations | Number of Pending operations in device |
| Disk Used (Pct) | Disk percent used, where type of usage are free, used, and reserved in device |
| Bytes Read/Sec | Disk bytes read in device per second |
| Weighted I/O Time (ms)/Sec | Weighted number of millisecond spent I/O operation in device per second |
| Disk Bytes Transferred Kilobytes/Sec | Disk bytes transferred in kilobytes per second |
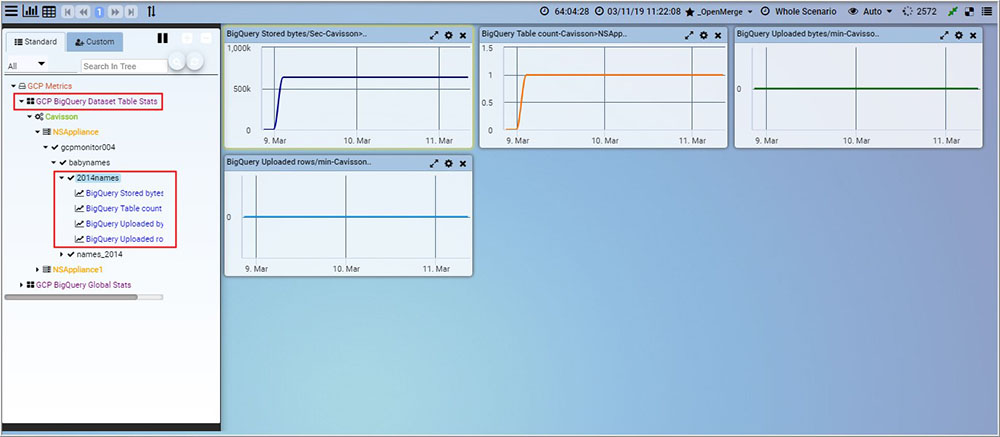
BigQueryDatasetStats
| Metric | Metric Description |
|---|---|
| BigQuery Stored bytes/Sec | Number of bytes stored per second |
| BigQuery Table count | Number of tables |
| BigQuery Uploaded bytes/min | Uploaded bytes per minute |
| BigQuery Uploaded rows/min | Uploaded rows per minute |
BigQueryGlobalStats
| Metric | Metric Description |
|---|---|
| BigQuery Queries Count | Number of In-flight queries |
| BigQuery Scanned Bytes/Min | Number of scanned bytes per minute |
| BigQuery Scanned Bytes Billed/Min | Number of server scanned bytes billed per minute |
| BigQuery Slots Used By Project | Number of slots used by project |
| BigQuery Total Slots | Total number of BigQuery slots available for the project |
| BigQuery Average Query Execution Time (Sec) | Average query execution time in seconds |
| BigQuery 5th Percentile Query Execution Time (Sec) | 5th percentile of time taken for processing query in seconds |
| BigQuery 50th Percentile Query Execution Time (Sec) | 50th percentile of time taken for processing query in seconds |
| BigQuery 95th Percentile Query Execution Time (Sec) | 95th percentile of time taken for processing query in seconds |
| BigQuery 99th Percentile Query Execution Time (Sec) | 99th percentile of time taken for processing query in seconds |
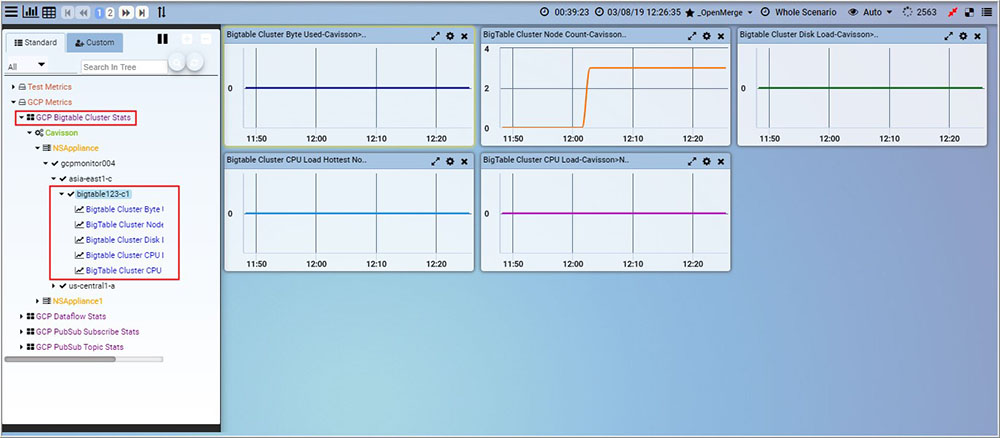
BigtableClusterStats
| Metric | Metric Description |
|---|---|
| Bigtable Cluster Byte Used | Amount of compressed data for tables stored in a cluster |
| BigTable Cluster Node Count | Number of nodes in a cluster |
| Bigtable Cluster Disk Load | Utilization of HDD disks in a cluster |
| Bigtable Cluster CPU Load Hottest Node | CPU load of the busiest node in a cluster |
| BigTable Cluster CPU Load | CPU load of a cluster |
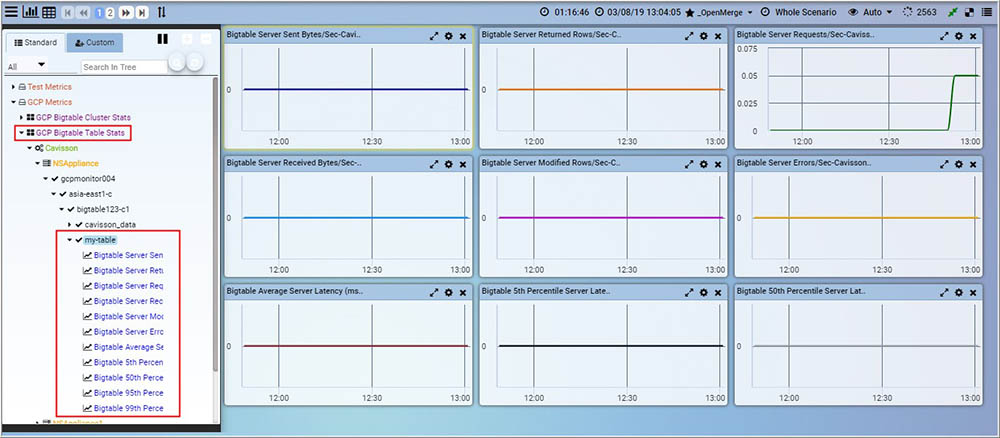
BigtableTableStats
| Metric | Metric Description |
|---|---|
| Bigtable Server Sent Bytes/Sec | Number of uncompressed bytes of response data sent by servers for a table |
| Bigtable Server Returned Rows/Sec | Number of rows returned by server requests for a table |
| Bigtable Server Requests/Sec | Number of server requests for a table |
| Bigtable Server Received Bytes/Sec | Number of uncompressed bytes of request data received by servers for a table |
| Bigtable Server Modified Rows/Sec | Number of rows modified by server requests for a table |
| Bigtable Server Errors/Sec | Number of server requests for a table that failed with an error |
| Bigtable Average Server Latency (ms) | Average server request latency for a table in milliseconds |
| Bigtable 5th Percentile Server Latency (ms) | 5th percentile server request latency for a table in milliseconds |
| Bigtable 50th Percentile Server Latency (ms) | 50th percentile server request latency for a table in milliseconds |
| Bigtable 95th Percentile Server Latency (ms) | 95th percentile server request latency for a table in milliseconds |
| Bigtable 99th Percentile Server Latency (ms) | 95th percentile server request latency for a table in milliseconds |
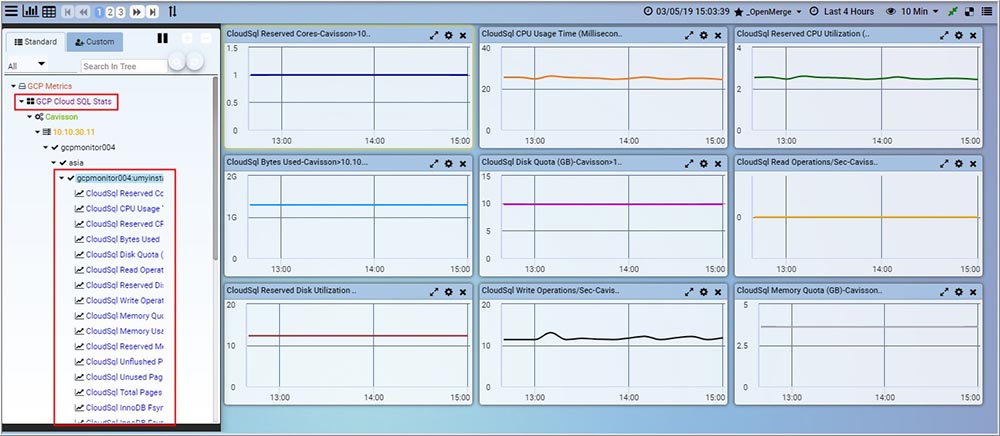
CloudSqlStats
| Metric | Metric Description |
|---|---|
| CloudSql Reserved Cores | Number of cores reserved for the database |
| CloudSql CPU Usage Time (Millisecond/Sec) | CPU usage time in millisecond per second |
| CloudSql Reserved CPU Utilization (Pct) | Fraction of the reserved cpu that is currently in use |
| CloudSql Bytes Used | Data utilization in bytes |
| CloudSql Disk Quota (GB) | Maximum data disk size in giga bytes |
| CloudSql Read Operations/Sec | Number of data disk read i/o operations per second |
| CloudSql Reserved Disk Utilization (Pct) | Fraction of the disk quota that is currently used in percentage |
| CloudSql Write Operations/Sec | Number of disk write i/o operations per second |
| CloudSql Memory Quota (GB) | Maximum ram size in giga bytes |
| CloudSql Memory Usage (MB) | RAM usage in mega bytes |
| CloudSql Reserved Memory Utilization (Pct) | Fraction of the memory quota that is currently used in percentage |
| CloudSql Unflushed Pages In InnoDB Buffer Pool | Number of unflushed pages in the inno db buffer pool |
| CloudSql Unused Pages In InnoDB Buffer Pool | Number of unused pages in the inno db buffer pool |
| CloudSql Total Pages In InnoDB Buffer Pool | Total number of pages in the inno db buffer pool |
| CloudSql InnoDB Fsync() Calls/Sec | Number of inno db fsync() calls per second |
| CloudSql InnoDB Fsync() Calls To Log File/Sec | Number of inno db fsync() calls to the log file per second |
| CloudSql InnoDB Pages Read/Sec | Number of inno db pages read per second |
| CloudSql InnoDB Pages Written/Sec | Number of inno db pages written per second |
| CloudSql Queries Executed By Server/Sec | Number of statements executed by the server per second |
| CloudSql Statements Executed By Server Sent By The Client/Sec | Number of statements executed by the server sent by the client per second |
| CloudSql Bytes Received By MySQL Process/Sec | Number of bytes received by mysql process per second |
| CloudSql Failover Operations Available On Master Instance | Number of failover operations is available on the master instance per second |
| CloudSql Read Replica Is Behind Its Master (Sec) | Number of seconds the read replica is behind its master |
| CloudSql Bytes Sent By MySQL Process/Sec | Number of bytes sent by mysql process per second |
| CloudSql Connections To MySQL Instance | Number of connections to the cloud sql mysql instance |
| CloudSql Bytes Received Through Network/Sec | Number of bytes received through the network per second |
| CloudSql Bytes Sent Count Through Network/Sec | Number of bytes sent through the network per second |
| CloudSql Cloud SQL PostgreSQL Instance Connections | Number of connections to the cloud sql postgresql instance |
| CloudSql Transaction Count/Sec | Number of transactions in postgresql per second |
| CloudSql Server UP Status | Indicates if the server is up or not. On-demand instances are spun down if no connections are made for a sufficient amount of time |
| CloudSql Instance Running Time (Millisecond/Sec) | Total time in seconds the instance has been running per second |
ComputeEngineStats
| Metric | Metric Description |
|---|---|
| Compute Engine Dropped Bytes/Sec | Number of incoming bytes dropped per second by the firewall |
| Compute Engine Dropped Packets/Sec | Number of incoming packets dropped per second by the firewall |
| Compute Engine Reserved Cores | Number of cores reserved on the host of the instance |
| Compute Engine Average CPU Usage (Sec) | Average CPU usage for all cores in seconds |
| Compute Engine Average CPU Utilization (Pct) | The fraction of the allocated CPU that is currently in use on the instance in percentage |
| Compute Engine Disk Read Bytes/Sec | Number of bytes read per second from disk |
| Compute Engine Disk Read Operations/Sec | Number of disk read IO operations per second |
| Compute Engine Throttled Read Bytes/Sec | Number of bytes per second in throttled read operations |
| Compute Engine Throttled Read Operations/Sec | Number of throttled read operations per second |
| Compute Engine Throttled Write Bytes/Sec | Number of bytes per second in throttled write operations |
| Compute Engine Throttled Write Operations/Sec | Number of throttled write operations per second |
| Compute Engine Disk Write Bytes/Sec | Number of bytes per second written to disk |
| Compute Engine Disk Write Operations/Sec | Number of disk write IO operations per second |
| Compute Engine Received Bytes/Sec | Number of bytes received per second from the network |
| Compute Engine Received Packets/Sec | Number of packets received per second from the network |
| Compute Engine Sent Bytes/Sec | Number of bytes sent per second over the network |
| Compute Engine Sent Packets/Sec | Number of packets sent per second over the network |
| Compute Engine Uptime (Sec) | How long the VM is up in millisecond per seconds |
DataProcHdfsYarnCustomStats
| Metric | Metric Description |
|---|---|
| Yarn Heap Memory Usage Committed (MB) | Amount of heap memory in megabytes Reserved in cluster |
| Yarn Heap Memory Usage Max (MB) | Amount of maximum heap memory used in megabytes in cluster |
| Yarn Heap Memory Used (MB) | Amount of heap memory used in megabytes in cluster |
| Yarn Non Heap Memory Usage Committed (MB) | Amount of non heap memory in megabytes Reserved in cluster |
| Yarn Non Heap Memory Usage Max (MB) | Amount of maximum non heap memory used in megabytes in cluster |
| Yarn Non Heap Memory Usage Used (MB) | Amount of non heap memory used in megabytes in cluster |
| Yarn Number Of Active NMs | Number of active NMs (Network management system) in cluster |
| Yarn Allocated Memory (MB) | Amount of memory allocated to yarn in megabytes on cluster |
| Yarn Application Submitted/Sec | Number of Application submitted on cluster |
| Yarn Available Memory (MB) | Amount of Available memory in megabytes on cluster |
| Yarn Pending Containers | Number of pending containers on cluster |
| Yarn Pending Memory (MB) | Amount of pending memory in megabytes on cluster |
| Yarn Reserved Memory (MB) | Amount of reserved memory in megabytes on cluster |
| HDFS Heap Memory Usage Committed (MB) | Amount of heap memory in megabytes Reserved for hadoop distributed file system in cluster |
| HDFS Heap Memory Usage Max (MB) | Amount of maximum heap memory used in megabytes for hadoop distributed file system in cluster |
| HDFS Heap Memory Usage Used (MB) | Amount of heap memory in megabytes used for hadoop distributed file system in cluster |
| HDFS Non Heap Memory Usage Committed (MB) | Amount of non heap memory in megabytes Reserved for hadoop distributed file system in cluster |
| HDFS Non Heap Memory Usage Max (MB) | Amount of maximum non heap memory used in megabytes Reserved for hadoop distributed file system in cluster |
| HDFS Non Heap Memory Usage Used (MB) | Amount of non heap memory used in megabytes Reserved for hadoop distributed file system in cluster |
| HDFS Capacity Remaining (GB) | Amount of memory remaining in gigabytes that are reserved for hadoop distributed file system in cluster |
| HDFS Capacity Total (GB) | Amount of memory in gigabytes that are reserved for hadoop distributed file system in cluster |
| HDFS Capacity Used (GB) | Amount of memory used in gigabytes that are reserved for hadoop distributed file system in cluster |
| HDFS Total Files | Number of files in hadoop distributed file system in cluster |
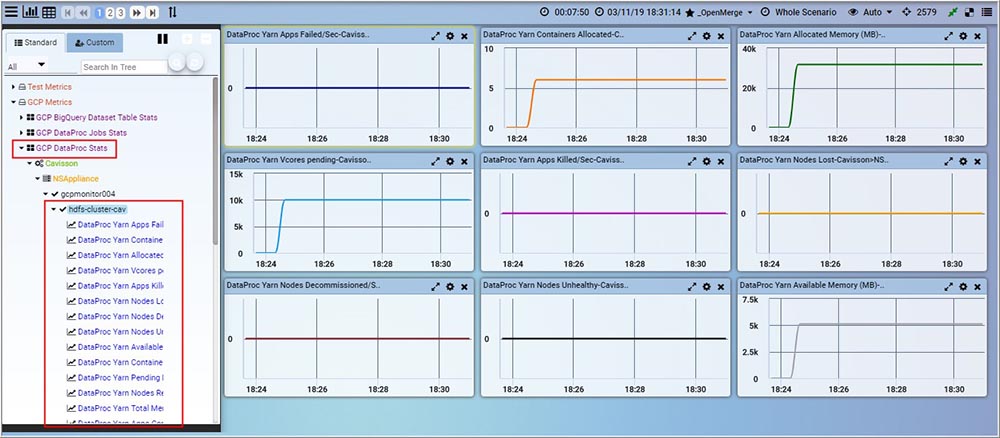
DataProcHdfsYarnStats
| Metric | Metric Description |
|---|---|
| DataProc Yarn Apps Failed/Sec | Number of yarn application failed in cluster per second |
| DataProc Yarn Containers Allocated | Number of Yarn containers allocated to cluster |
| DataProc Yarn Allocated Memory (MB) | Allocated yarn memory in megabytes to cluster |
| DataProc Yarn Vcores pending | Number of yarn virtual cores pending in cluster |
| DataProc Yarn Apps Killed/Sec | Number of yarn application killed in cluster per second |
| DataProc Yarn Nodes Lost | Number of yarn nodes lost in cluster |
| DataProc Yarn Nodes Decommissioned/Sec | Number of yarn nodes decommissioned in cluster per second |
| DataProc Yarn Nodes Unhealthy | Number of yarn nodes unhealthy in cluster |
| DataProc Yarn Available Memory (MB) | Available yarn memory in megabytes in cluster |
| DataProc Yarn Containers Reserved | Number of Yarn containers reserved in cluster |
| DataProc Yarn Pending Memory (MB) | Pending yarn memory in megabytes in cluster |
| DataProc Yarn Nodes Rebooted/Sec | Number of yarn nodes rebooted in cluster per second |
| DataProc Yarn Total Memory (MB) | Total yarn memory in megabytes in cluster |
| DataProc Yarn Apps Completed/Sec | Number of yarn application completed in cluster per second |
| DataProc Yarn Containers Pending | Number of Yarn containers pending in cluster |
| DataProc Yarn Apps Running | Number of yarn application running in cluster |
| DataProc Yarn Vcores Allocated | Number of yarn virtual cores allocated to cluster |
| DataProc Yarn Vcores Reserved | Number of yarn virtual cores reserved by cluster |
| DataProc Yarn Reserved Memory (MB) | Reserved yarn memory in megabytes by cluster |
| DataProc Yarn Total Vcores | Total number of yarn virtual cores available for cluster |
| DataProc Yarn Vcores Available | Number of yarn virtual cores available in cluster |
| DataProc Yarn Apps Submitted/Sec | Number of yarn application submitted in cluster per second |
| DataProc Yarn Nodes Active | Number of yarn nodes Active in cluster |
| DataProc Yarn Apps Pending | Number of yarn application pending in cluster |
| DataProc Dfs Capacity Used (Bytes) | Distributed file system capacity used in bytes |
| DataProc Dfs Capacity Present (Bytes) | Distributed file system capacity present in bytes |
| DataProc Dfs Nodes Decommissioned/Sec | Number of Distributed file system nodes decommissioned in cluster per second |
| DataProc Dfs Capacity Remaining (Bytes) | Distributed file system capacity remaining in bytes |
| DataProc Dfs Nodes Decommissioning | Number of Distributed file system nodes decommissioning in cluster |
| DataProc Dfs Blocks Missing | Number of Distributed file system blocks missing in cluster |
| DataProc Dfs Blocks Pending Deletion | Number of Distributed file system blocks pending for delete from cluster |
| DataProc Dfs Total Capacity (Bytes) | Distributed file system total capacity in bytes |
| DataProc Dfs Nodes running | Number of Distributed file system nodes running in cluster |
| DataProc Dfs Blocks Under Replication | Number of Distributed file system blocks under replication in cluster |
| DataProc Dfs Blocks Missing Replication | Number of Distributed file system blocks missing replication in cluster |
| DataProc Dfs Blocks Corrupt/Sec | Number of Distributed file system blocks corrupt in cluster per second |
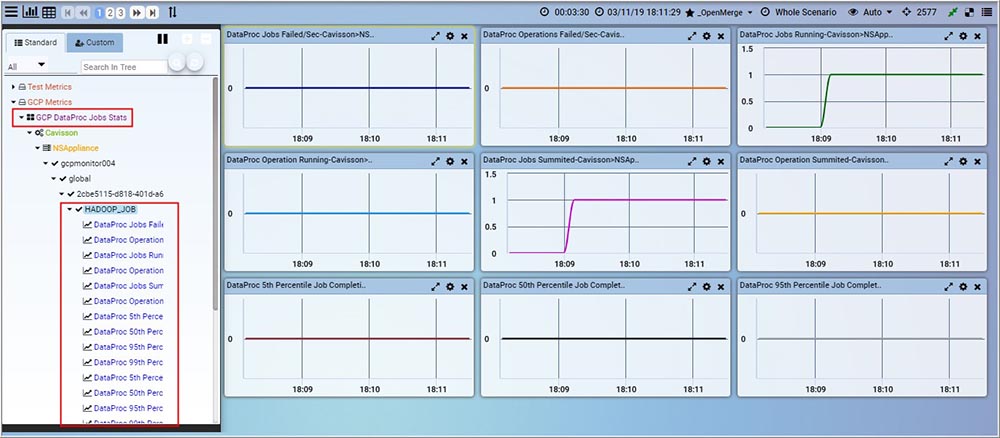
DataProcJobsStats
| Metric | Metric Description |
|---|---|
| DataProc Jobs Failed/Sec | Number of jobs failed in cluster per second |
| DataProc Operations Failed/Sec | Number of operation failed in cluster per second |
| DataProc Jobs Running | Number of jobs running in cluster |
| DataProc Operation Running | Number of operation running in cluster |
| DataProc Jobs Summited | Number of jobs submitted in cluster for execution |
| DataProc Operation Summited | Number of operation submitted in cluster for execution |
| DataProc 5th Percentile Job Completion Time (ms) | 5th percentile of time in millisecond, when jobs took to complete from the time the user submits a job to the time Dataproc reports it is completed |
| DataProc 50th Percentile Job Completion Time (ms) | 50th percentile of time in millisecond, when jobs took to complete from the time the user submits a job to the time Dataproc reports it is completed |
| DataProc 95th Percentile Job Completion Time (ms) | 95th percentile of time in millisecond, when jobs took to complete from the time the user submits a job to the time Dataproc reports it is completed |
| DataProc 99th Percentile Job Completion Time (ms) | 99th percentile of time in millisecond, when jobs took to complete from the time the user submits a job to the time Dataproc reports it is completed |
| DataProc 5th Percentile Job Time Taken (ms) | 5th percentile of time in millisecond jobs have spent in a given state |
| DataProc 50th Percentile Job Time Taken (ms) | 50th percentile of time in millisecond jobs have spent in a given state |
| DataProc 95th Percentile Job Time Taken (ms) | 95th percentile of time in millisecond jobs have spent in a given state |
| DataProc 99th Percentile Job Time Taken (ms) | 99th percentile of time in millisecond jobs have spent in a given state |
| DataProc 5th Percentile Operation Completion Time (ms) | 5th percentile of time in millisecond operations took to complete from the time the user submits a operation to the time Dataproc reports it is completed |
| DataProc 50th Percentile Operation Completion Time (ms) | 50th percentile of time in millisecond operations took to complete from the time the user submits a operation to the time Dataproc reports it is completed |
| DataProc 95th Percentile Operation Completion Time (ms) | 95th percentile of time in millisecond operations took to complete from the time the user submits a operation to the time Dataproc reports it is completed |
| DataProc 99th Percentile Operation Completion Time (ms) | 99th percentile of time in millisecond operations took to complete from the time the user submits a operation to the time Dataproc reports it is completed |
| DataProc 5th Percentile Operation Time Taken (ms) | 5th percentile of time in millisecond operation have spent in a given state |
| DataProc 50th Percentile Operation Time Taken (ms) | 50th percentile of time in millisecond operation have spent in a given state |
| DataProc 95th Percentile Operation Time Taken (ms) | 95th percentile of time in millisecond operation have spent in a given state |
| DataProc 99th Percentile Operation Time Taken (ms) | 99th percentile of time in millisecond operation have spent in a given state |
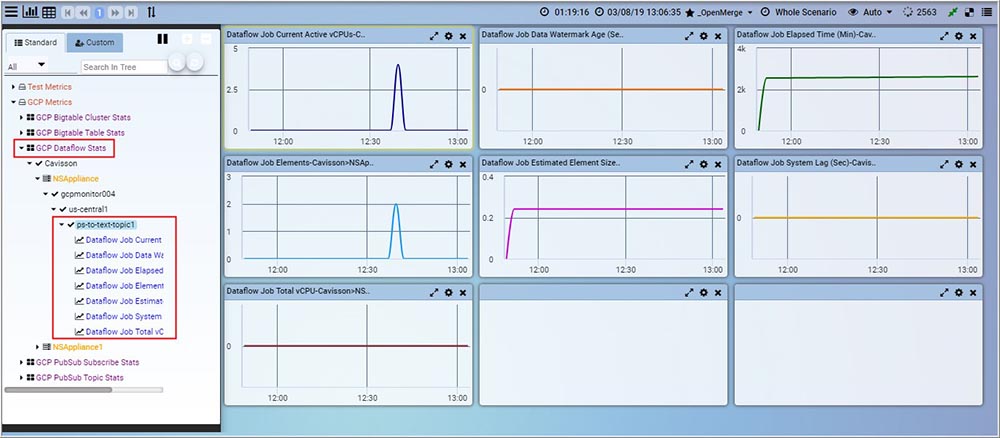
DataflowStats
| Metric | Metric Description |
|---|---|
| Dataflow Job Current Active vCPUs | Number of vCPUs currently being used by this Dataflow job |
| Dataflow Job Data Watermark Age (Sec) | The age of the most recent item of data that has been fully processed by the pipeline in seconds |
| Dataflow Job Elapsed Time (Min) | Time duration that the current run of this pipeline has been in the Running state so far, in minutes |
| Dataflow Job Elements | Number of elements added to the pcollection (multi-element data set) so far |
| Dataflow Job Estimated Element Size (KB) | An estimated element size (in Kilobytes) added to the pcollection (multi-element data set) so far. Dataflow calculates the average encoded size of elements in a pcollection and multiplies it by the number of elements |
| Dataflow Job System Lag (Sec) | Current maximum duration that an item of data has been awaiting processing, in seconds |
| Dataflow Job Total vCPU | Total vCPU seconds used by this dataflow job |
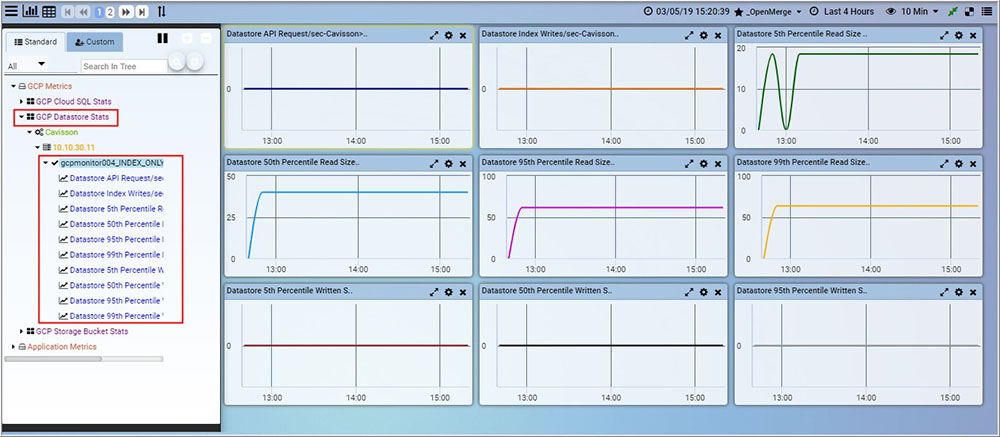
DatastoreStats
| Metric | Metric Description |
|---|---|
| Datastore API Request/sec | Number of API calls per second |
| Datastore Index Writes/sec | Number of index writes per second |
| Datastore 5th Percentile Read Size Entities (Bytes) | 5th percentile read size entities in bytes |
| Datastore 50th Percentile Read Size Entities (Bytes) | 50th percentile read size entities in bytes |
| Datastore 95th Percentile Read Size Entities (Bytes) | 95th percentile read size entities in bytes |
| Datastore 99th Percentile Read Size Entities (Bytes) | 99th percentile read size entities in bytes |
| Datastore 5th Percentile Written Size Entities (Bytes) | 5th percentile write size entities in bytes |
| Datastore 50th Percentile Written Size Entities (Bytes) | 50th percentile write size entities in bytes |
| Datastore 95th Percentile Written Size Entities (Bytes) | 95th percentile write size entities in bytes |
| Datastore 99th Percentile Written Size Entities (Bytes) | 99th percentile write size entities in bytes |
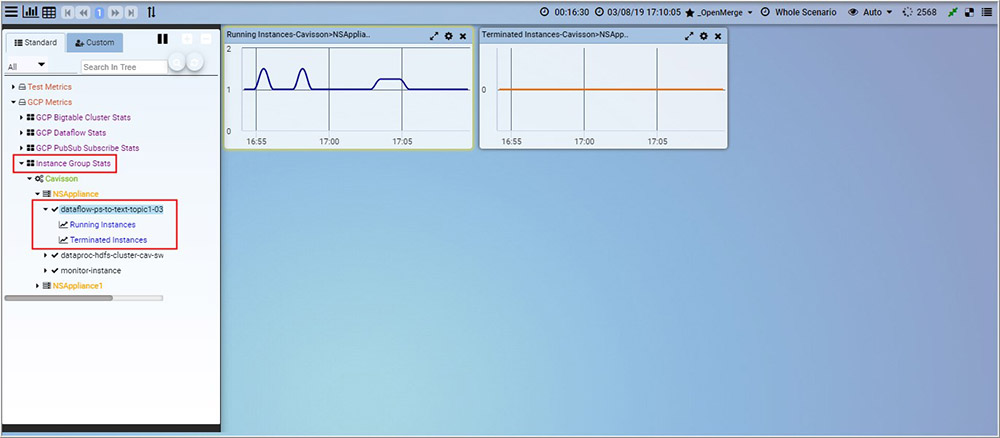
InstanceGroupStats
| Metric | Metric Description |
|---|---|
| Running Instances | Number of running instances in an instance group |
| Terminated Instances | Number of terminated instances in an instance group |
MySQLBackupStats
| Metric | Metric Description |
|---|---|
| Full Backup Status | Backup status (status = 1, backup service is active and status = 0, indicate is inactive) |
| Incremental Backup Status | Backup status (status = 1, backup service is active and status = 0, indicate is inactive) |
| Full Backup Size (MB) | The total amount of space used in Megabytes for full backup |
| Incremental Backup Size (MB) | The total amount of space used in Megabytes for Incremental backup |
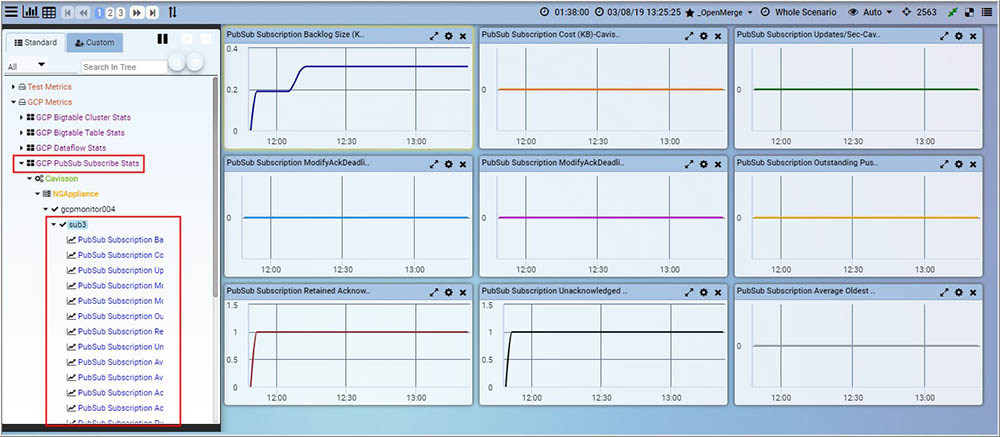
PubSubSubscriptionStats
| Metric | Metric Description |
|---|---|
| PubSub Subscription Backlog Size (KB) | Total size of the unacknowledged messages (backlog messages) in a subscription in Kilobytes |
| PubSub Subscription Cost (KB) | Cost of operations per subscription, measured in Kilobytes. This is used to measure utilization for quotas |
| PubSub Subscription Updates/Sec | Number of configuration changes per subscription, grouped by operation type and result |
| PubSub Subscription ModifyAckDeadline Message Operations/Sec | Number of modify acknowledgment deadline message operations per second, grouped by result |
| PubSub Subscription ModifyAckDeadline Requests/Sec | Number of Modify Acknowledgment Deadline requests, grouped by result |
| PubSub Subscription Outstanding Push Messages | Number of messages delivered to a subscription’s push endpoint, but not yet acknowledged |
| PubSub Subscription Retained Acknowledged Messages | Number of acknowledged messages retained in a subscription |
| PubSub Subscription Unacknowledged Messages | Number of unacknowledged messages (backlog messages) in a subscription |
| PubSub Subscription Average Oldest Retained Acknowledged Message Age (Sec) | Average Age (in seconds) of the oldest acknowledged message retained in a subscription |
| PubSub Subscription Average Oldest Unacknowledged Message Age (Sec) | Average Age (in seconds) of the oldest unacknowledged message (backlog message) in a subscription |
| PubSub Subscription Acknowledged Message Operations/Sec | Number of acknowledge message operations per second, grouped by result |
| PubSub Subscription Acknowledge Requests/Sec | Number of acknowledge requests per second, grouped by result |
| PubSub Subscription Pull Operations/Sec | Number of pull message operations per second, grouped by result |
| PubSub Subscription Pull Requests/Sec | Number of pull requests per second, grouped by result |
| PubSub Subscription Push Requests/Sec | Number of push attempts per second, grouped by result |
| PubSub Subscription Average Retained Acknowledged Size (Bytes) | Average byte size of the acknowledged messages retained in a subscription |
| PubSub Subscription Streaming Pull Acknowledge Message Operations/Sec | Number of streaming Pull acknowledge message operations per second, grouped by result |
| PubSub Subscription Streaming Pull Acknowledge Requests/Sec | Number of streaming pull requests per second with non-empty acknowledge ids, grouped by result |
| PubSub Subscription Streaming Pull Message Operations/Sec | Number of streaming pull message operations per second, grouped by result |
| PubSub Subscription Streaming Pull Modify Acknowledged Deadline Message Operations/Sec | Number of streaming Pull Modify acknowledged Deadline operations per second, grouped by result |
| PubSub Subscription Streaming Pull Modify Acknowledged Deadline Requests/Sec | Number of streaming pull requests per second with non-empty Modify acknowledged Deadline fields, grouped by result |
| PubSub Subscription Streaming Pull Responses/Sec | Number of streaming pull responses per second, grouped by result |
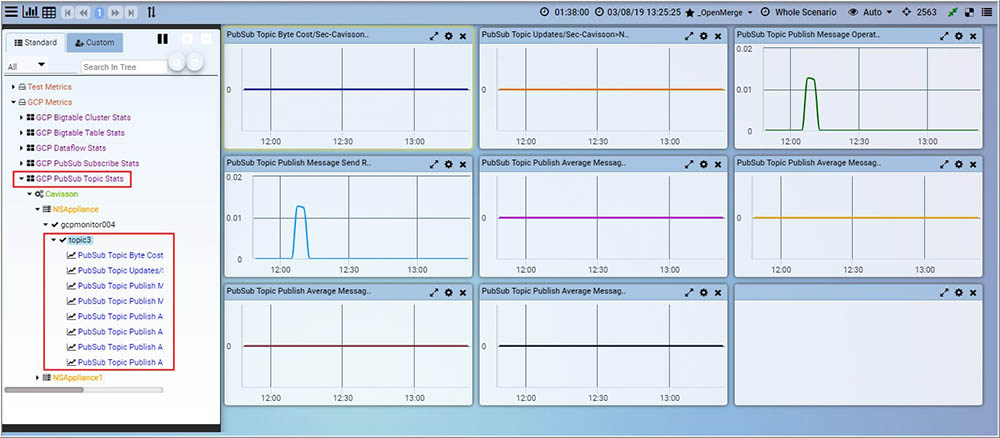
PubSubTopicStats
| Metric | Metric Description |
|---|---|
| PubSub Topic Byte Cost/Sec | Cost of operations per topic per second, measured in bytes. This is used to measure utilization for quotas |
| PubSub Topic Updates/Sec | Number of configuration changes per topic per second, grouped by operation type and result |
| PubSub Topic Publish Message Operations/Sec | Number of publish message operations per second, grouped by result |
| PubSub Topic Publish Message Send Request/Sec | Average of publish requests per second, grouped by result |
| PubSub Topic Publish Average Message Size 5th Percentile (Bytes) | 5th percentile of publish message size in bytes |
| PubSub Topic Publish Average Message Size 50th Percentile (Bytes) | 50th percentile of publish message size in bytes |
| PubSub Topic Publish Average Message Size 95th Percentile (Bytes) | 95th percentile of publish message size in bytes |
| PubSub Topic Publish Average Message Size 99th Percentile (Bytes) | 99th percentile of publish message size in bytes |
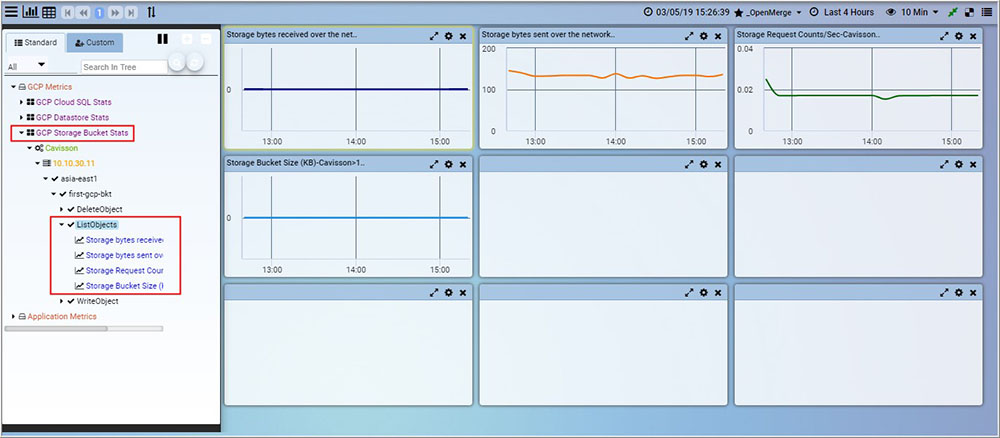
StorageBucketStats
| Metric | Metric Description |
|---|---|
| Storage bytes received over the network (KB) | Count of bytes received over the network in kilobyte, grouped by the API method (Write, Read ,Delete, etc.) and response code |
| Storage bytes sent over the network (KB) | Count of bytes sent over the network in kilobyte, grouped by the API method (Write, Read, Delete, etc.) and response code |
| Storage Request Counts/Sec | Number of API calls, grouped by the API method (Write, Read, Delete, etc.) and response code per second |
| Storage Bucket Size (KB) | Total size of all objects in the bucket |
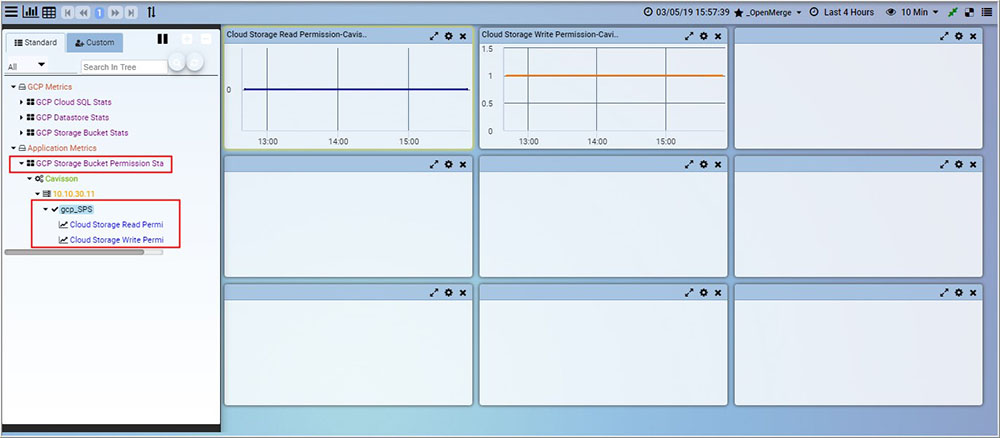
StoragePermissionStats
| Metric | Metric Description |
|---|---|
| Cloud Storage Read Permission | Read permission Status. 1= Allowed, 0= Not Allowed |
| Cloud Storage Write Permission | Write permission Status. 1= Allowed, 0= Not Allowed |
AutoScaler
| Metric | Metric Description |
|---|---|
| Minimum Replicas | Minimum number of replicas |
| Maximum Replicas | Maximum number of replicas |
| Target CPU Utilization (Pct) | Target CPU utilization percentage |
GCPDatastore Metrics
DatastoreStats
| Metric | Metric Description |
|---|---|
| Datastore API Request/sec | Number of API calls per second |
| Datastore Index Writes/sec | Number of index writes per second |
| Datastore 5th Percentile Read Size Entities (Bytes) | 5th percentile read size entities in bytes |
| Datastore 50th Percentile Read Size Entities (Bytes) | 50th percentile read size entities in bytes |
| Datastore 95th Percentile Read Size Entities (Bytes) | 95th percentile read size entities in bytes |
| Datastore 99th Percentile Read Size Entities (Bytes) | 99th percentile read size entities in bytes |
| Datastore 5th Percentile Written Size Entities (Bytes) | 5th percentile write size entities in bytes |
| Datastore 50th Percentile Written Size Entities (Bytes) | 50th percentile write size entities in bytes |
| Datastore 95th Percentile Written Size Entities (Bytes) | 95th percentile write size entities in bytes |
| Datastore 99th Percentile Written Size Entities (Bytes) | 99th percentile write size entities in bytes |