Docker-based Applications Monitoring
Monitoring Capabilities
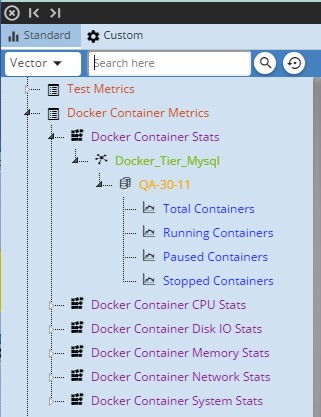
Docker Info Stats
These are stats about the container – in various states – running, paused, stopped. This also provides insight into total number of containers. This stat is on Server level.
| Graph Name | Description |
|---|---|
| Total Containers | Total number of containers. |
| Running Containers | Total number of running containers. |
| Paused Containers | Total number of paused containers. |
| Stopped Containers | Total number of stopped containers. |
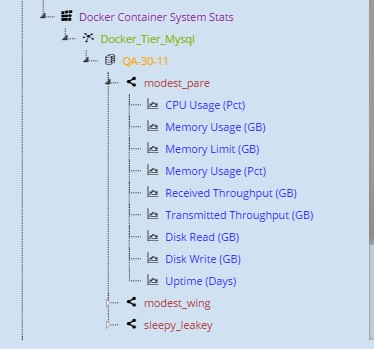
Docker System Stats
This stat monitors the system stats of every container installed. These stats include CPU usage, System usage etc.
| Graph Name | Description |
|---|---|
| CPU Usage (Pct) | CPU usage in percentage. |
| Memory Usage (GB) | Memory usage in GB. |
| Memory Limit (GB) | Max memory available in GB. |
| Memory Usage (Pct) | Memory usage in Percentage. |
| Received Throughput (GB) | Received Network Throughput in GB. |
| Transmitted Throughput (GB) | Transmitted Network Throughput in GB. |
| Disk Read (GB) | Disks read in GB. |
| Disk Write (GB) | Disks write in GB. |
| Uptime (Days) | Total time the docker container has been running in days. |
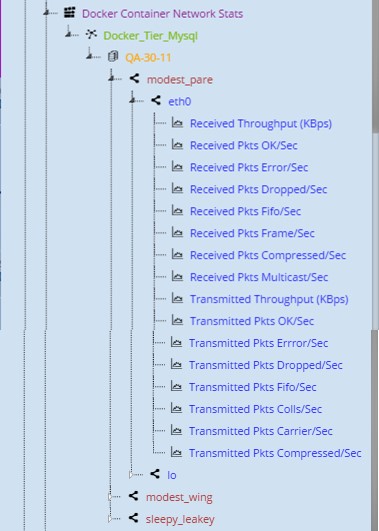
Docker Network Stats
This monitors the network stats on each interface for every container.
| Graph Name | Description |
|---|---|
| Received Throughput (KBps) | Received throughput in KiloBytes per second. |
| Received Pkts OK/Sec | Error Free Packets received per Sec. |
| Received Pkts Error/Sec | Damaged Packets received per Sec. |
| Received Pkts Dropped/Sec | Dropped Packets received per Sec. |
| Received Pkts Fifo/Sec | fifo Packets received per Sec. |
| Received Pkts Frame/Sec | Frame Packets received per Sec. |
| Received Pkts Compressed/Sec | Compressed Packets received per Sec. |
| Received Pkts Multicast/Sec | Multicast Packets received per Sec. |
| Transmitted Throughput (KBps) | Transmitted throughput in KiloBytes per second. |
| Transmitted Pkts OK/Sec | Transmitted Error Free Packets per Sec. |
| Transmitted Pkts Errror/Sec | Transmitted Damaged Packets per Sec. |
| Transmitted Pkts Dropped/Sec | Transmitted Dropped Packets per Sec. |
| Transmitted Pkts Fifo/Sec | Transmitted fifo Packets per Sec. |
| Transmitted Pkts Colls/Sec | Transmitted collision Packets per Sec. |
| Transmitted Pkts Carrier/Sec | Transmitted carrier Packets per Sec. |
| Transmitted Pkts Compressed/Sec | Transmitted compressed Packets per Sec. |
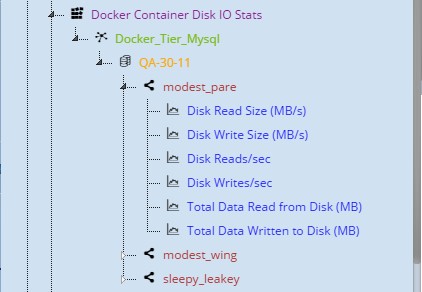
Docker IO Stats
It monitors the stats related to the input / output data.
| Graph Name | Description |
|---|---|
| Disk Read Size (MB/s) | Size of disk reads per second in MB by container. |
| Disk Write Size (MB/s) | Size of disk writes per second in MB by container. |
| Disk Reads/sec | Number of disk reads per second by container. |
| Disk Writes/sec | Number of disk writes per second by container. |
| Total Data Read from Disk (MB) | Total data read from disk in MB. |
| Total Data Written to Disk (MB) | Total data written to disk in MB |
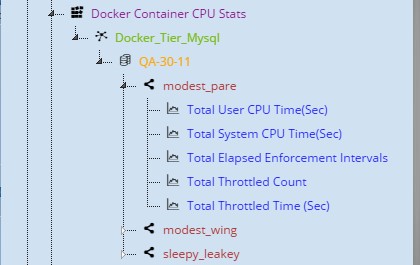
Docker CPU Stats
This stat monitors the CPU, for example: user CPU time, System CPU time etc.
| Graph Name | Description |
|---|---|
| Total User CPU Time(Sec) | Time spent (in seconds) by tasks of the container in user mode. |
| Total System CPU Time(Sec) | Time spent (in seconds) by tasks of the container in kernel mode. |
| Total Elapsed Enforcement Intervals | Number of enforcement intervals that have elapsed. |
| Total Throttled Count | Number of times, task in this container has been throttled. |
| Total Throttled Time (Sec) | Total time (in seconds) for which tasks in container have been throttled. |
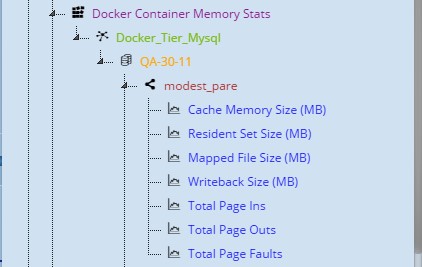
Docker Memory Stats
This monitors stats related to memory, for example, cache memory size, write back size etc.
| Graph Name | Description |
|---|---|
| Cache Memory Size (MB) | Page cache memory. |
| Resident Set Size (MB) | RSS(anonymous and swap cache memory) in MB. |
| Mapped File Size (MB) | Mapped file (includes tmpfs/shmem) in MB. |
| Writeback Size (MB) | Writebacks in MB. |
| Total Page Ins | Total number of pages paged in. |
| Total Page Outs | Total number of pages paged out. |
| Total Page Faults | Total number of page faults |