Introduction
It is impossible to know how your system will perform when faced with expected or unexpected demands without comprehensive performance testing, which includes both load and stress testing. The best way to understand how components of a system behave under a given situation is to ensure an exhaustive test coverage covering all aspects of application performance under varying loads and scenarios is designed to test your applications thoroughly.
To establish the benchmark behavior of your application ecosystem, you must test the performance of your application and its underlying dependencies and infrastructure. In performance testing, you aim to meet or exceed a number of industry-defined benchmarks.
Is Your Application Ready for Varying User Traffic?
The first move in planning for varying degrees of user traffic or load as we call it, is getting a conception of where, how, and why your applications might fail. Because many people are turning away from shopping in the real world, new customers might be different from the ones you already know. They may buy a greater variety of products, they may be new to shopping online, and they may not limit their shopping just to publicize deals. Try to expect the user experience your customers might encounter and advance it for all.
If you don’t take dynamic steps to address a website or app performance, peaks in online traffic can cause websites or apps to slow down and ultimately crash. According to research by Google, 53% of mobile users entirely abandon websites that take longer than 3 seconds to load.
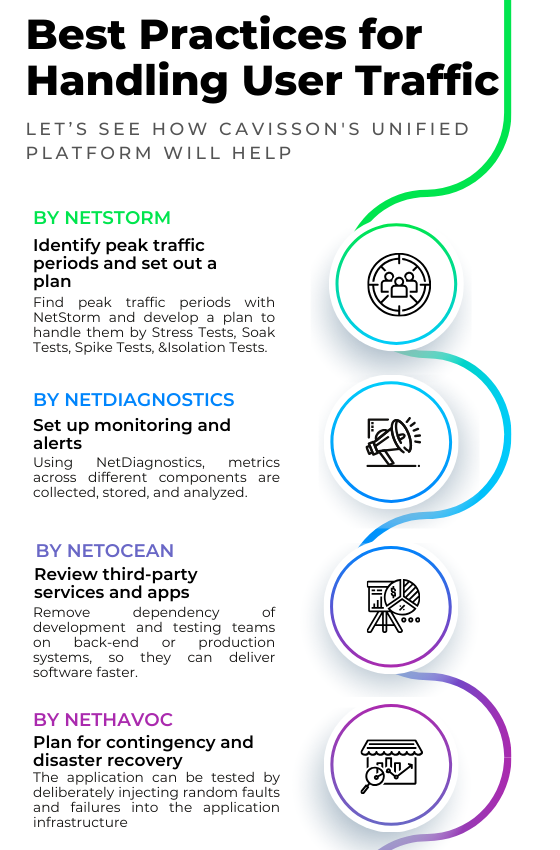
Best Practices for Handling User Traffic:
Too much web traffic can greatly slow down all access to a website. This is caused by more file requests going to the server than it can handle and may be an intentional attack on the site or simply caused by demand.
To make sure you are ready for varying application loads – here are eight best practices to implement a productive performance test for both consumer-facing and internal applications.
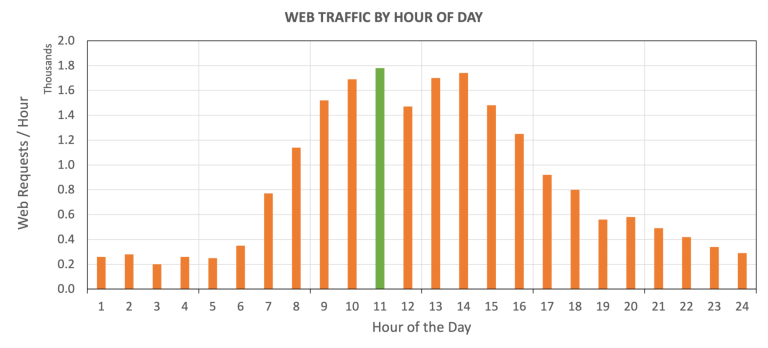
Identify peak traffic periods and set out a plan.
Focussing on traffic analytics from preceding years will help you set assumptions for this year. With covid 19 the normal peak traffic period for the holiday season may be a little different from other years. Due to delivery slow-downs, you may see traffic peaks in November rather than December.
To make sure your website can handle the uptick in user traffic, you need to first and foremost understand the characteristics of the same i.e. volume, distribution, and frequency. You will need to define the number of synchronous users, the hold time or times, traffic spikes, and complex user scenarios. Take into consideration your traffic from the previous year, the changes in your traffic over the last months, your marketing efforts for Black Friday, any special offers you have that might cause a spike in your traffic, and your users’ behavior.
To make sure that your business-critical applications can handle surges in traffic, you can perform the following tests:
- Load Tests –
Load testing is used to determine how a system will behave under normal and peak load conditions. It aids in determining an application’s maximum operating capacity, as well as any bottlenecks, and which element is causing degradation.
When a system is designed for several parallel users who are required to access the system online, it becomes very critical for application developers to find out how the system is going to behave when the load reaches or crosses a threshold. Load or endurance testing involves subjecting the system to an increasing load, which starts from the low end, then moves to moderate, and finally reaches its peak. The system is constantly observed in terms of its response time, resource usage, and reliability of its functionality.
- Stress Tests –
Stress testing is a type of performance testing that takes place when your app, API, or software is pushed to its limits. It works by revealing how well your system will handle a sudden surge in demand when the number of users on your system exceeds the maximum capacity.
- Soak Tests –
Soak testing involves requesting the designed load on a system to detect performance-related issues such as stability and response time. The system is then tested to see if it can withstand a significant load for an extended period, allowing for the measurement and analysis of its reaction and behavior under long-term use. Load testing, also known as soak testing, is a type of load testing.
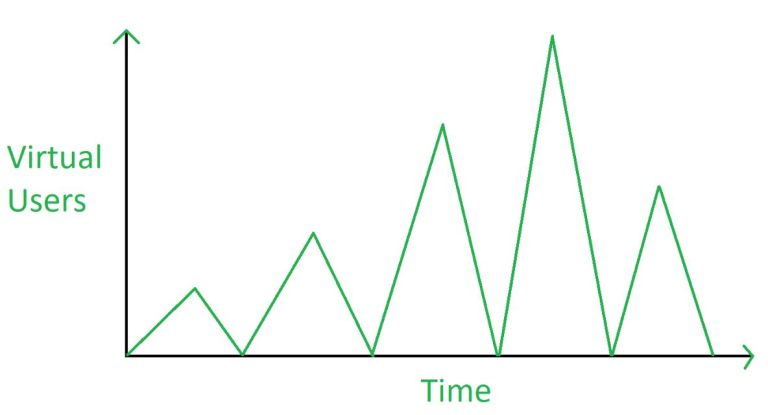
- Spike Tests –
Spike testing is a type of performance testing in which the load on an application is suddenly increased or decreased. Spike testing is used to see how a software application reacts when it is subjected to large fluctuations in traffic. Spike testing verifies the application’s recovery time between activity spikes as well as the application’s maximum load. The term “spike” refers to a sudden change in traffic volume.
- Isolation Tests –
Isolation testing is the process of disassembling a system into individual modules so that flaws can be easily identified. This is especially true when the bug is difficult to find and fix by the development team.
Find peak traffic periods with NetStorm and develop a plan to handle them
NetStorm makes testing with millions of active users not only possible but easy to manage. The ability to run high-volume tests in a controlled lab environment allows multiple executions while “tweaking” appropriate variables being analyzed, with the assurance that other variables will not change.
Make your site/application load faster on mobile devices
In today’s world, websites we build for clients use mobile-first UI frameworks and work well over different screen sizes. But you need to research even deeper about latency, performance, and speed on mobile devices/websites. Modified pages may help with translation, but they could be slower than pages with static content and images.
Mobile devices testing with NetStrom
RDT or Real Device Testing is a mobile app and web testing service that enables developers to run their tests on real, physical Android, and iOS devices that are hosted on secure premises. NetStorm / RDT can automate functional, performance, stress, regression, and stability testing of Android & iOS apps and associated services. NetStorm’s RDT provides a versatile mobile-application testing platform using real iOS and Android devices.
RDT Capabilities for Ensuring Seamless Mobile Applications:
- Ensure Exceptional Customer Experience of applications on
- Customer handsets/devices
- Real Desktop browsers
- Meaningful Performance Results
- Timing Aggregation/Comparison
- Rendering visual comparison
- Recommendations
- Mix with Simulated device/browser load.
- Integrated with Cavisson solution suite for a server-side deeper diagnosis.
Set up monitoring and alerts
In a distributed environment, you can find multiple servers hosting a single application with multiple processes and services running on each. In cases of application outages/code or service level issues that impact user experience, it is not easy to diagnose the root cause unless alert/diagnosis data is available across different components i.e. network, infrastructure, application, third-party callouts, etc.
This is where our end-to-end observability platform, NetDiagnostics, comes into the picture. Using NetDiagnostics, metrics across different components are collected, stored, and analyzed. Using this data, NetDiagnostics alerts when any of these metrics are going from normal to a warning state based on the thresholds and gives early warning before it reaches a critical state. Once an alert comes then using advanced in-built analytics, you can find the erroneous components and drastically reduce your MTTR and MTTD.
Our unified performance intelligence platform has an in-build support of proactive alerting through which users can get notified whenever a KPI (Key Performance Indicator metrics like CPU utilization, request per second, average response time, etc.) breaches the threshold configured as part of alert rules. This allows users to get early notification of performance degradation even before an actual issue happens.
Our alerts come in three varieties:
Capacity Alerts – In this type of alert, alert generation is done based on a fixed threshold value. The user needs to define a Rule and Condition with a threshold value. If the condition is met, then the alert is generated.
Behavior Alerts -In this case, alerts are generated based on % deviation from the auto-generated baseline trends. The purpose of dynamic threshold is to:
- Provide adaptive threshold functionality for Alert.
- Generate alerts based on Identifying the baseline on the current load at a specific hour of the day.
Load Index-based Alerts – This is a highly advanced type of baseline alert, which is unique to the NetDiagnostics alert framework and it works based on the load on the system instead of a time-based trend. In this baseline, the alert engine learns the system behavior on all the loads and then utilizes this learning to compare the current data at the current load with the baseline value at the current load. Upon closely monitoring an application’s behavior, it is seen that the response time of an application is proportional to the load (PVS – page views per second) on the system.
For example, if the load (page views per second) is 10, and let us assume that the response time is 100 ms, then, if the load becomes 20 PVS, the response time also becomes high; let’s say it goes to 200 ms, and so on. Therefore, if at one particular time, the value of response time goes to 500ms on a load of 20 PVS then ideally there must be an issue and it should generate an alert.
All monitors and alerts should be reviewed regularly and especially before a known peak traffic period. You should make sure that alert email addresses, mobile phone numbers, and Slack channels are up to date and that all notifications get through without winding up as spam. Where practicable, test these monitors and alerts against an unproductive environment.
Cavisson’s product suite is integrated with multiple platforms like PagerDuty, BigPanda, Spark, and ServiceNow to name a few. You can utilize these integrations to directly inform important stakeholders whenever a critical issue is observed.
Load test
We do not suggest load testing on a production site when you have peak traffic. Rather, you should perform load tests on your pre-production environment, in advance to have metrics to compare with and to know how much your current architecture can handle. The load testing results can also be used to adjust back-end code, caching, front-end performance, and even database indexes.
Load testing should be carried out continuously and especially whenever new features are introduced to your website. Normally the load-testing phase begins when most functional testing is complete and the system is more or less meeting functional requirements.
Unlike functional testing, the objective of load testing is not to discover defects. Here the objective is to discover bottlenecks. While functional testing is carried out with one or a few users, load testing requires deploying field scenarios where hundreds or thousands of users interact with frontend software, such as a website, or a backend system. When this load crosses a threshold and overloads the system beyond its designed capacity, it comes into the domain of stress or fatigue testing. The goal of stress testing is to break the system with excessive load and to assess the quick and graceful recovery of the system after a crash.
Load testing is made easier with NetStorm.
NetStorm is a load generation tool that mimics the activities of hundreds of thousands of users sending requests to and receiving responses from websites in a customized and controlled manner. NetStorm can use multiple protocols to interact with target websites. NetStorm achieves this by creating virtual users that make these connections to server(s), send requests, and process the responses received in an orchestrated manner. Apart from requests and responses, it also collects data from websites to monitor performance.
Scale-up infrastructure on-demand
Maybe 10 years ago, you needed to allocate for and provision your infrastructure almost a year ahead. But with cloud-based infrastructure, girding your infrastructure happens at the touch of a button.
During peak traffic, rules can be put in place to impulsively scale up or scale out your infrastructure depending on usage metrics. As easy as it sounds, there are hazards such as file locking, database concurrency, session handling and stale data which can impact user experiences. At one point your peak traffic period is over, those same rules can scale down your infrastructure to handle normal daily traffic.
Review third-party services and apps
We have seen a rogue Google Tag Manager (GTM) script change show a whole site down. Seems impractical and initially, that’s what we thought too. Third-force inclusions such as GTM, Facebook Pixel tags, and others could make or break the experience for your customers. Your uptime and infrastructure monitors are green. But your customers are not able to make a purchase. This could be easy as a third party not serving a web font or a required JavaScript file. Having an official of third-party services used on your website is a start. From there, you need to plan how to reduce issues if any of these services are unavailable. It could be as easy as delaying a script file loading in the front end.
Let’s talk about how NetOcean lets you review third-party services and apps:
NetOcean is a powerful back-end application simulator that removes dependencies on back-end applications and third-party systems to enable faster quality & performance testing and accelerated time-to-market. Enterprises rely on NetOcean to stay focused on the system under test, reduce the overall cost of ownership for application testing, and reduce the time-to-market of their software applications.NetOcean tests various protocols like HTTP, HTTPS, JMS, and pop3. It has bundles of static resources of different sizes i.e. 1k, 10k, and 1 MB (responses).
You can ensure your site readiness by utilizing NetOcean’s service virtualization capabilities to:
- Remove dependencies on external systems and applications during performance testing. For example, an e-commerce application has to integrate with a third-party payment gateway. Hence testing the checkout functionality of this application has a dependency on the payment gateway.
- Remove dependency of development and testing teams on back-end or production systems, so they can deliver software faster.
Plan for contingency and disaster recovery
In an ideal world, you should be set for stress-free user traffic. But the unthinkable could happen. Your cloud service provider could go down or one service in a particular region could be impassive. An urgent code fix could have an unpredicted effect & consequences. Eventuality planning is key to this. Start with a support policy in place for your databases and assets. Fully automated CI/CD pipelines will allow deploying code to any new architecture as well. Cloud providers such as Microsoft Azure and Amazon AWS allow for a geo-replication that allows for your website to function even if a data center ceases to exist. Decide how much downtime you can tolerate and work your way from there when planning for an eventuality and a disaster recovery.
NetHavoc helps you plan for contingency and disaster recovery-
NetHavoc can change performance engineering and qualitative delivery on a massive scale. Deal with uncertainty before they cause obstacles in real time. NetHavoc breaks the application infrastructure on purpose to create chaos in a controlled environment.
NetHavoc is a powerful tool that allows users to test the resilience of the applications. The overall performance of a service is directly linked to the ability to tolerate failures. This aspect of an application/software can be tested by deliberately injecting random faults and failures into the application infrastructure. NetHavoc enables you to inject various faults into the application infrastructure in production and pre-production environments. The after-effects of the fault injection can be monitored through our powerful monitoring capabilities.
Conclusion
Cavisson Systems Inc., is your one stop shop for ensuring that critical applications are able to handle varying real world load with ease. Combining performance testing with service virtualization, chaos engineering and end to end monitoring enables engineering teams to have complete insight across all application components which helps them in identifying areas that need improvement.
Having such unparalleled insight before moving to production not only improves your time to market but in case an issue arises in production, the organization is well equipped to replicate it in the test environment to easily identify the root cause behind such issues. With this level of control and insight, deliver innovation at scale & speed without worrying about adversely affecting your end customers.