In computing, the term “bottleneck” refers to an overloaded network, a device whose one component is unable to keep pace with the rest of the system, thus slowing overall performance, or an application issue that may be causing your customers/end-users to wait indefinitely while performing business critical operations.
Fixing bottleneck issues usually results in returning the system to a stable level of performance; however, to fix bottleneck issues, it is necessary to first identify where the issue lies which decides the all-important metric(s) – mean time to detect (MTTD) & mean time to resolve (MTTR).
Poor application performance can be caused by a variety of factors. Even just a few seconds of application downtime can have an adverse effect on revenues, reputation, and customer satisfaction. Understanding and overcoming barriers to optimal application performance is crucial to delivering the best experience to each user.
Among the most common bottleneck causes are:
⇛ CPU Utilization
The problem occurs when the processor is so overloaded that it cannot respond to requests for time. In other words, the central processing unit (CPU) is overloaded and unable to accomplish tasks in a timely manner. A CPU bottleneck manifests as two things: a processor running at over 80 percent capacity for a prolonged period, and an overly long processor queue. The main reasons for CPU utilization bottlenecks are insufficient system memory and constant interruptions from input/output devices. In order to resolve these issues, you need to increase CPU power, add more random access memory (RAM), and improve software coding efficiency.
Due to the growing complexity of websites and apps-with more JavaScript, more images, and layers of complexity that simply weren’t considered in the mid-2000s-it has become increasingly important to pay attention to browser performance on mobile devices, especially those that don’t have a lot of memory or a powerful CPU. Try running your app on devices with varying CPU capabilities and see how it runs using Chrome DevTools to throttle the CPU. Make sure not to go easy on the CPU. By pushing it to its limits, you’ll expose its weaknesses. Additionally, these stress tests will help detect performance hiccups.
⇛ Software Limitations
Performance dips caused by bottlenecks can sometimes be caused by software. Programs can sometimes be built to handle only a finite number of tasks at once, so even when additional resources are available, the program won’t use any of them.
In most cases, application problems arise from transactions that overload the database or system resources, such as static content, authentication, connection pools, etc. in an inefficient manner. There are many instances where application environments, such as web servers, are configured with default settings that do not respond well to peak load traffic.
⇛ Disk Usage
Long-term storage, which includes HDDs and SSDs, is usually the slowest component inside a computer or server and is often an unavoidable bottleneck. It can be difficult to troubleshoot this bottleneck because even the fastest long-term storage solutions have physical speed limits. On a physical level, address insufficient bandwidth by switching to faster storage devices and expanding RAID (a data storage virtualization technology) configurations.
⇛ Memory Utilization
There is a memory bottleneck when there is not enough or fast enough RAM in the system. This limits the speed at which the RAM can serve information to the CPU, which slows down overall application performance. When the system has insufficient memory, the computer will start offloading storage to a much slower hard disk drive (HDD) or solid-state drive (SSD). The device will experience a slowdown and low CPU usage if the RAM is unable to serve data fast enough to the CPU.
Typically, the issue is resolved by installing more memory or faster RAM. When RAM is too slow, it must be replaced, whereas capacity bottlenecks can be resolved simply by adding more memory. Often, the problem arises from a programming error known as a “memory leak,” which occurs when a program does not release memory to the system after it has been used. An update to the program is required to fix this issue.
⇛ Server Performance
If you only concentrate on the front end and neglect the back end, you could be setting yourself up for failure. Bottlenecks and performance glitches can also occur on the server, which must be closely monitoring and detecting anomalies with application performance monitoring (APM) software, you can prevent major problems in the future.
When it comes to APM, there is a substantial divide between front-end and back-end developers. Companies with JavaScript-heavy front ends are less likely to use APM, while those with more traditional backends, or those with complex front ends, are more likely to use APM. Due to this, both camps deserve a monitoring solution that integrates what users see on the front end with the backend processing, which can often be achieved through the concept of a Business Transaction.
Optimize performance by cutting through complexity
Today’s digital world demands flawless end-user experiences, but the sheer complexity of modern applications often compromises performance. You’ll be able to avoid slow-downs and eliminate obstacles to optimal application performance by understanding the factors that negatively impact application performance and having strategies in place to utilize modern tools and technologies to avoid them.
Cavisson NetDiagnostics Enterprise (NDE) is a comprehensive Application Performance Management (APM) solution for real-time monitoring, diagnostics, and management of distributed processing in your application environment using state of art technologies with minimal overhead. Leading Fortune 500 brands rely on NDE to avert risks, reduce revenue loss, and improve customer loyalty by enabling proactive monitoring and real-time diagnosis of application performance issues.
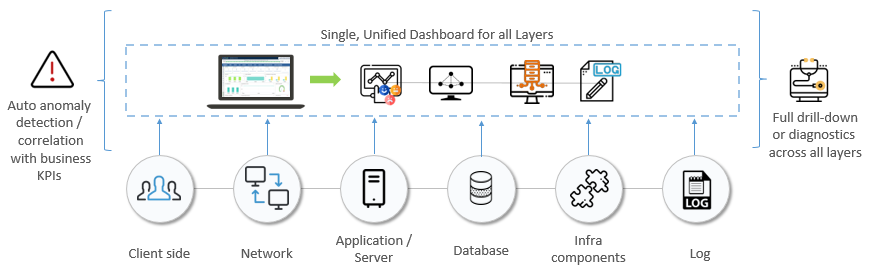
The traditional methodology has led to a siloed approach for application, infrastructure, user experience and log monitoring, making it difficult for enterprises to identify the root cause which ends up in a continuous cycle of identifying and rectifying production bugs.
To eliminate the diverse silos, a solution can’t simply stitch it all together. It has to bring together teams through a single common language. Bridging these gaps with a single source of truth removes confusion and multiplies productivity across teams, and that is what NetDiagnostics does by providing a one-stop solution for all your monitoring requirements.
This cross-team collaboration and more efficient working environment drastically reduces mean time to detect and resolve issues (MTTD & MTTR) and facilitates your teams to bring in optimizations that drive better user experiences.
With customer experience being one of the deciding factors for retention, it’s imperative to deliver faultless end-user experiences, but the sheer complexity of modern applications frequently jeopardizes performance. NetDiagnostics Enterprise is created with the sole purpose of enabling your technology teams to quickly identify the root cause behind an issue. Easily identifying issues becomes such a crucial factor as once identified, you can move towards bridging the gap between the customer’s expectation and your application’s performance and reduce both MTTD & MTTR significantly.
Contact us today and witness a digital transformation across your application ecosystem.