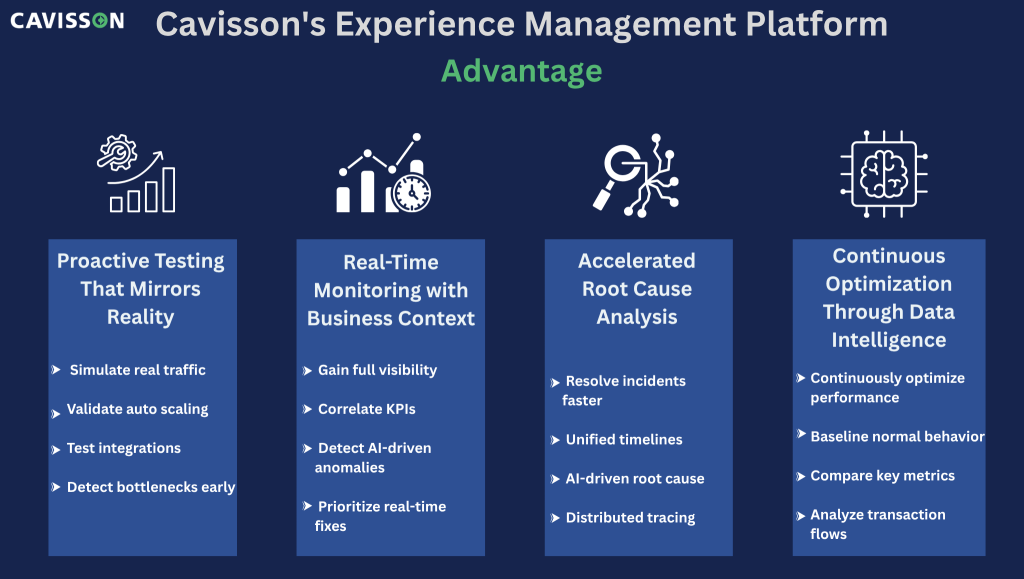
- A single timeline correlates load test results, production metrics, and deployment events
- Distributed tracing automatically maps requests across microservices
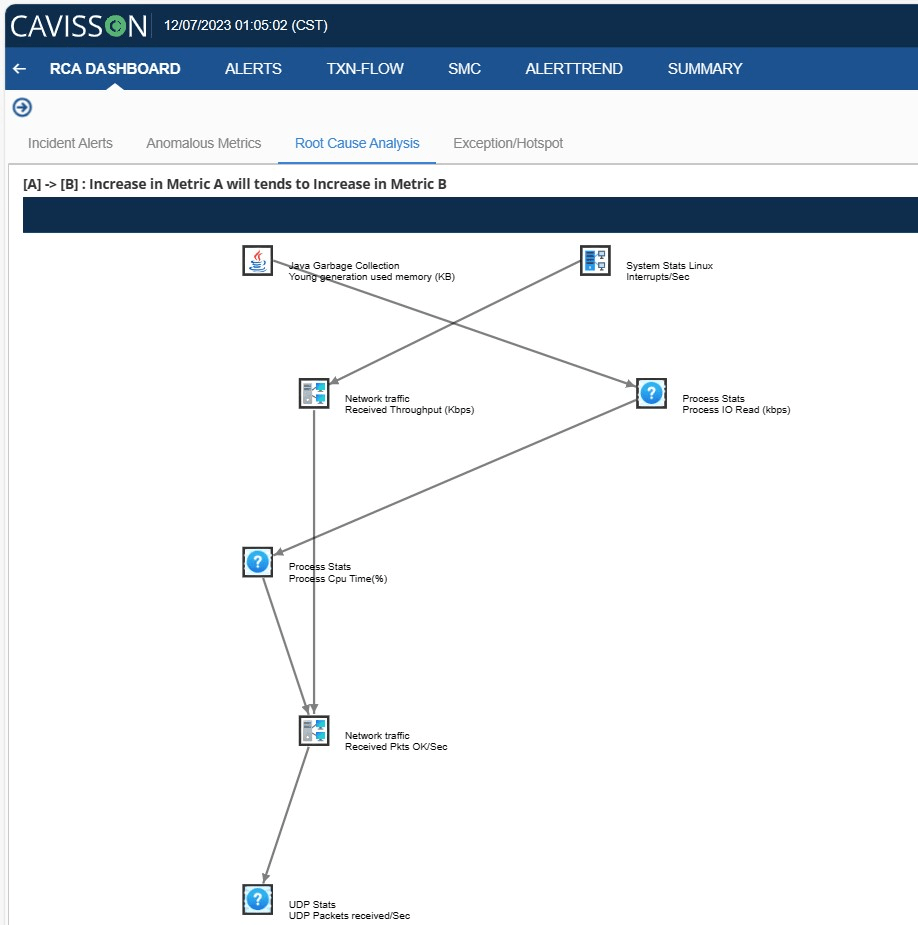
- AI-powered diagnostics suggest probable causes based on historical patterns
- One dashboard gives every stakeholder—from developers to executives—the visibility they need
4. Continuous Optimization Through Data Intelligence
Beyond firefighting, unified platforms enable continuous performance improvement:
- Baseline normal behavior to detect degradation early
- Compare pre-production test results with live production metrics
- Identify optimization opportunities through transaction flow analysis
- Build a knowledge base of performance patterns that improve year over year
Real-World Impact: From Chaos to Control
Consider a major retail client who partnered with Cavisson before last year’s Black Friday. Previously reliant on disconnected monitoring and reactive firefighting, they faced a critical decision: continue with the status quo risk or transform their approach.
The Challenge:
- Checkout completion rates dropped to 62% during the previous peak events
- Average MTTR for performance incidents: 47 minutes
- No clear visibility into third-party service impacts
- Testing cycles took weeks due to dependency constraints
The Unified Approach: Using Cavisson’s integrated platform, they implemented:
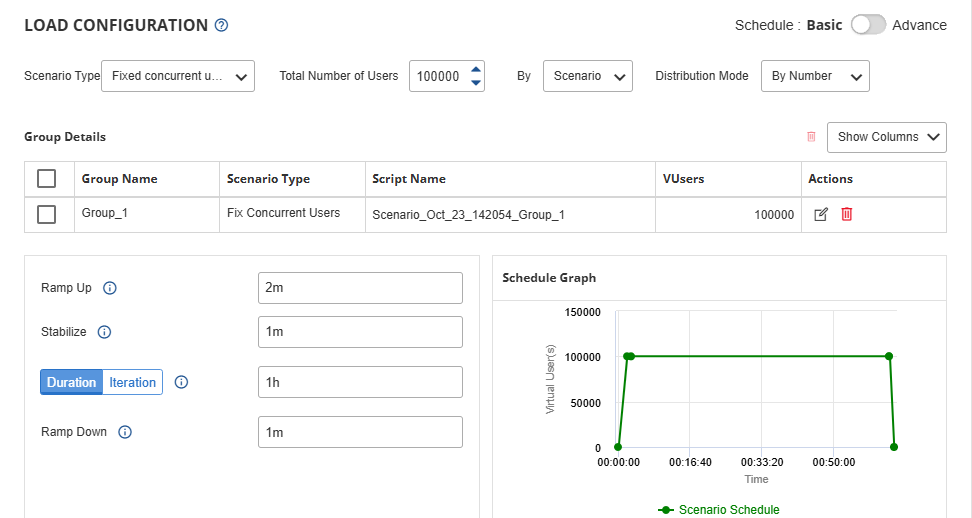
- Comprehensive load testing with service virtualization for all payment gateways
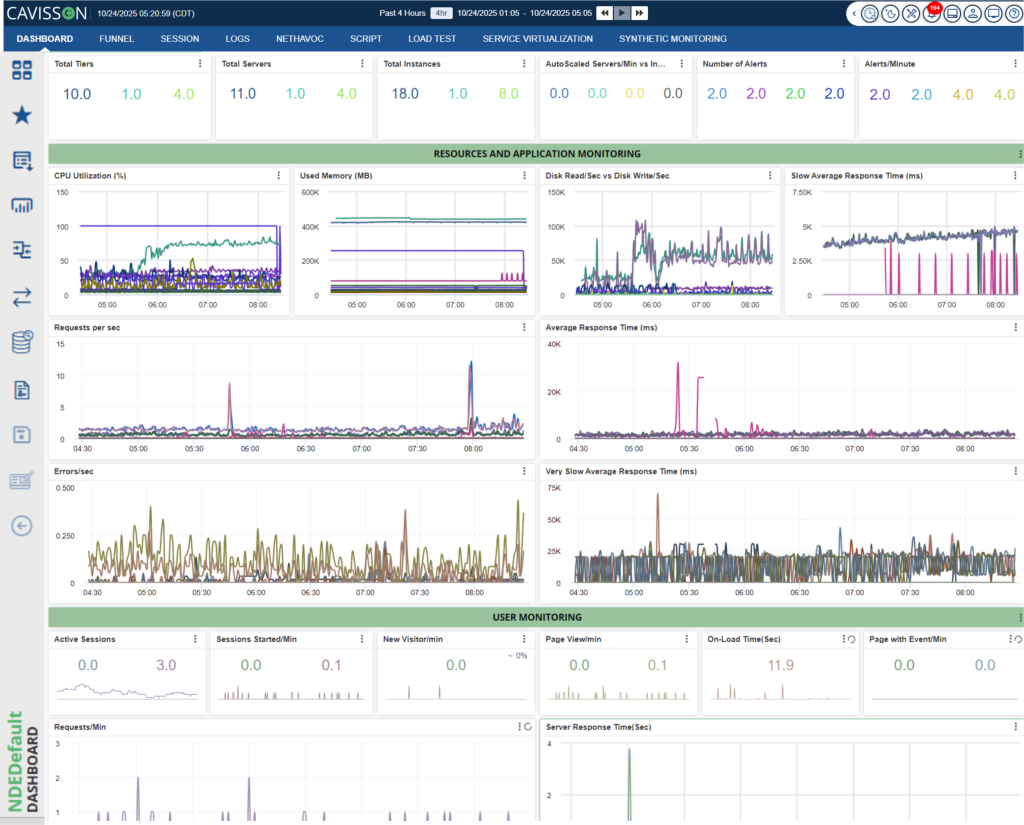
- Real-time monitoring across 200+ microservices
- AI-driven alerting with automatic root cause suggestions
- Single-pane visibility for cross-functional war rooms
The Results:
- MTTR reduced to 8 minutes: Unified visibility eliminated diagnostic guesswork
- Checkout rates improved to 94%: Proactive testing identified and resolved bottlenecks pre-launch
- Zero revenue-impacting outages: During the highest traffic event in company history
- 73% reduction in escalations: Issues resolved before customers noticed
More importantly, their performance team transitioned from reactive crisis management to proactive optimization, continuously improving conversion rates throughout the holiday season.
Get Performance-Ready Before Peak Traffic Hits
Black Friday success isn’t determined on the day itself—it’s won in the weeks of preparation that precede it. The question isn’t whether you can afford to invest in unified experience management. It’s whether you can afford not to.
As traffic projections climb and customer expectations intensify, the gap between resilient businesses and vulnerable ones widens. Organizations that embrace end-to-end visibility, AI-driven insights, and proactive testing position themselves not just to survive peak season but to dominate it.
Don’t wait for downtime to expose your blind spots.
Cavisson’s unified platform combines enterprise-grade load testing, real-time application monitoring, service virtualization, and AI-powered analytics—giving you complete visibility and control over digital experiences when it matters most.
Ready to turn Black Friday from a risk into an opportunity?
Click for schedule your performance readiness assessment
Let’s ensure your infrastructure is as ambitious as your revenue targets.