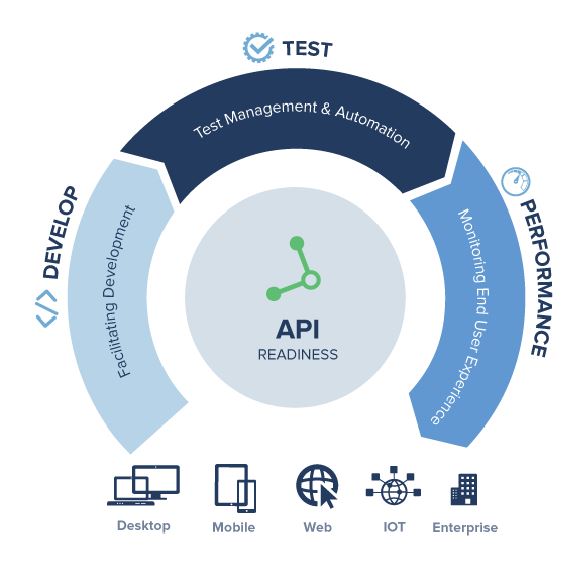
Why API Monitoring Matters
Many of us can now say that our web applications are built on an API foundation, both internally and externally. It’s common to discuss which APIs we need to expose to the outside world in order to drive business and, in some cases, to build APIs into the product roadmap during planning meetings. With so much emphasis on APIs, it’s critical to recognize its inherent power and ensure that appropriate safeguards are in place to protect it.
API Errors Are Frequently The Most Serious Errors
Because a single API can impact so many applications/components, modifying or deprecating it can result in massive failures that you may not be able to forecast, especially if the API is public. Once you’ve made your API available to other developers, either in a controlled manner to trusted partners or publicly to anyone with a developer/production key, you’re responsible for ensuring that nothing interferes with its performance. The quality of the API and its performance is affected by factors such as server load, the amount of data coming down, the level of encryption, and the quality of the controller code among many others.
Of course, you should test all of this before putting your API into production, but you should also monitor those factors after deployment, just like any other important feature. Problems arise when your customers start banging on it in new and different ways. API monitoring can help with this. The significance of monitoring APIs in production is becoming more apparent as we become more reliant on our own and third-party APIs. Because it can bring down so many other dependent applications, an API failure can be more disastrous than an application failure. The API management platforms are all acknowledging the need for some kind of analytics dashboard that goes beyond just showing usage statistics as time goes on.
Creating API Monitors
A cornerstone of your online quality strategy should be creating monitors for APIs you either produce or consume (or both). One of the last excuses you have for not setting up your first API monitor is that you don’t know what to think about or where to begin – so let’s get you started with some practical advice for setting up your first API monitor.
Tip 1: Re-Use Functional Tests From Development
Reusing functional API tests created during development and testing for monitoring has several advantages if you’re providing your own APIs:
- Instead of just checking for availability, your API’s “real” functionality will be continuously scrutinized, providing you with a safety net for ongoing deployment practices and infrastructure changes.
- Because your functional API tests are configured to assert and provide relevant error messages, your API monitors will be able to provide much more detailed error information for root cause analysis than regular availability monitors.
- Because your functional API monitors simulate expected usage scenarios, their actual structure can inform Ops about how your APIs will be used and assist them in setting up the API infrastructure accordingly.
- Using a single tool to create tests and monitors has obvious advantages in terms of maintenance, learning, and cost.
Tip 2: Create Tests That Mimic Your Use Cases
If you primarily integrate with third-party APIs (such as Twitter or Google Maps), you must ensure that you are aware of any errors before your users become aware. It’s critical that the monitors you construct reflect how you use the API.
For example, if you’re using the Flickr API to retrieve the most recent photographs for a certain Flickr group, make sure your API monitor does the same thing, rather than returning a list of popular cameras (or anything else that is easier to set up). Also, make sure you’re tracking the complete cycle of your use cases; don’t just track the initial API request; track them all, in order, just like your app does. When it comes to monitoring 3rd party APIs, this is a hard one. Frequently, your monitor may want to validate some form of output based on your input. Another example you might want to validate the coordinates or route plan you get back from one of the Google Maps APIs to ensure that you always get the desired results. Unfortunately, Google routinely updates coordinates on the fourth decimal, so if your monitor doesn’t account for this “volatility,” it may fail unnecessarily. The same is true for route planning; if a traffic jam is causing Google to provide an “unexpected” result for a limited time – something for which you should be prepared.
Tip 3: Use A Dedicated Account
Many (most) APIs need you to include credentials or an access key in your requests; ensure you’re using a dedicated account(s) for both your own and third-party API monitoring. This is due to a number of factors, including- It allows you to run your monitors with the same access privileges as your users for your own APIs, so you can notice problems that might not affect “super-user” accounts. It also allows you to manage billing and bandwidth usage separately from your “production” API usage for 3rd party APIs.
Monitor APIs with NetVision Synthetic monitoring
NVSM or NetVision Synthetic Monitoring is an active monitoring approach through the simulation of typical user navigation paths using scripts. It monitors availability and various metrics of performance for critical web pages. It is based on multiple locations and supports script recording via multiple channels, such as desktop, mobile, etc.
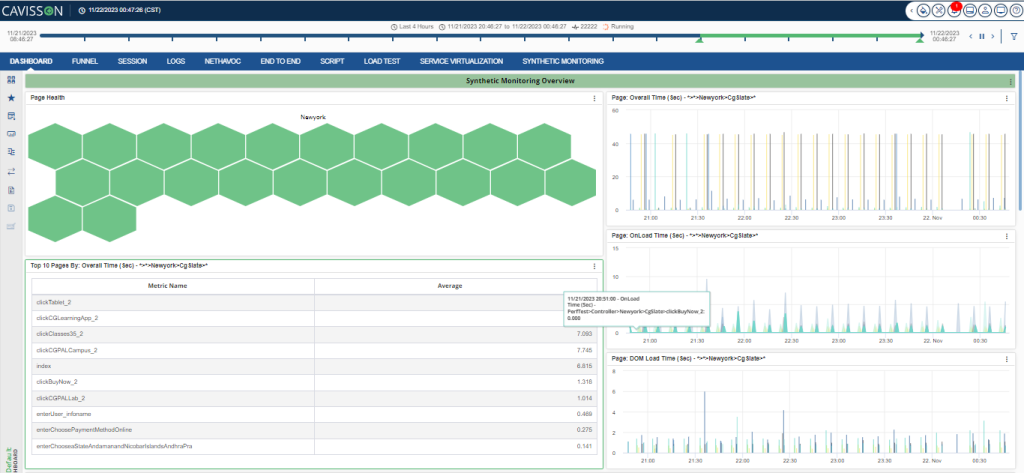
Features of NetVision Synthetic monitoring
1. Monitor multi-channel web site all the time from multi-location-
- Measure entire multi-page workflows simulating a complete customer navigation path including form data submission and user-actions click and record scripting of tests.
- Benchmark against the competition and baseline the performance for each critical page through scheduled reporting.
- Real-time alerts for any degradation in performance or availability.
2. Configure service for round-the-clock availability monitoring
- Agents located at geographically distributed data centers around the world
- Add/delete locations as per demand for various jobs
- Use real browsers (Chrome, Firefox) that are used by customers
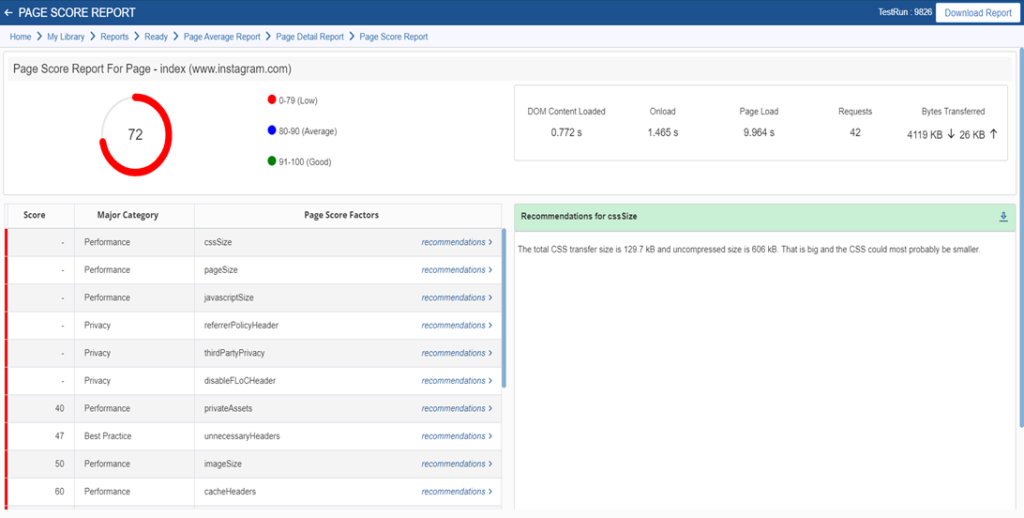
3. Analyze Performance issues instantaneously before it impact customers
- Drill down to analyze performance issues against baseline/trend and pinpoint what has caused degradation in performance.
- Full resource waterfalls and page performance load times from the browser timing and navigation APIs.
4. Dig into Back-end issues with integration of SM with NetDiagnostics
- Seamless tracking of web requests from front-end to backend server to get insight on backend issues. Tier/service/class/method taking time and identifying hot spots to greatly reduce your MTTD & MTTR.
Testing Your APIs
Software quality processes are increasingly common, spanning the entire lifecycle from development to production monitoring. The task of creating and maintaining high-quality software does not end with user acceptance or handover to operations. It must include operational reliability, availability, and performance. This is particularly true of the APIs you use. APIs are the foundational technology for cloud-based applications, mobile apps, and third-party applications. If your application doesn’t use third-party APIs, it’s almost certainly using your own. As the API industry grows, more discussions about API testing, governance, and stability are emerging. APIs are the foundational technology for cloud-based applications, mobile apps, and third-party applications. If your application doesn’t use third-party APIs, it’s almost certainly using your own. As the API industry grows, more discussions about API testing, governance, and stability are emerging.
Performance Planning and Testing
Take the time to write down your expectations for uptime and response times. Even if you haven’t made your APIs public, their performance has a significant impact on the performance of your application (and, by extension, the user experience). Know how much traffic you’ll be dealing with, how many concurrent requests you’ll be dealing with, and how much data will be passed. Planning ahead for your performance requirements ensures that proper testing and monitoring is carried out. Using a dedicated API load testing tool rather than an application load testing tool that tests APIs as a side effect of normal load testing can be more effective.
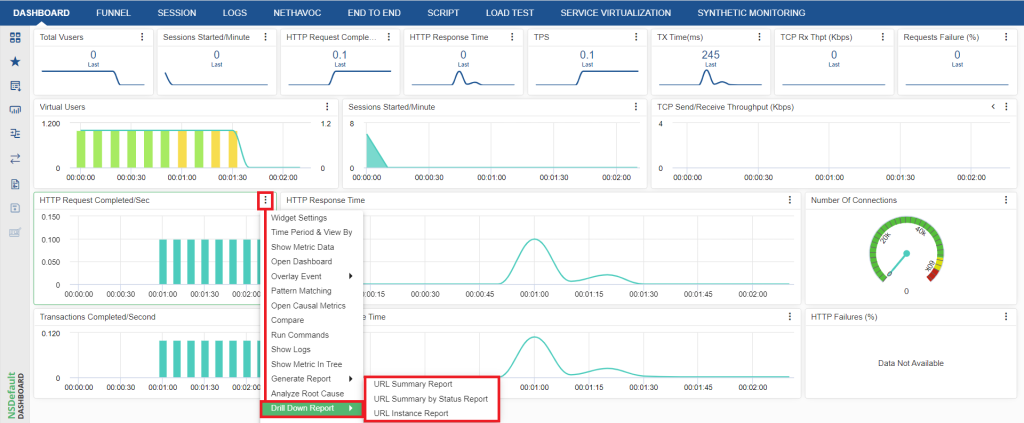
API Testing with NetStorm (Load Test)
NetStorm is a load-generation tool that mimics the activities of hundreds or thousands of users sending requests to and receiving responses from websites in a customized and controlled manner. NetStorm achieves this by creating virtual users that make these connections to server(s), send requests, and process the responses received in an orchestrated manner.
Apart from requests and responses, it also collects data from websites to monitor performance.
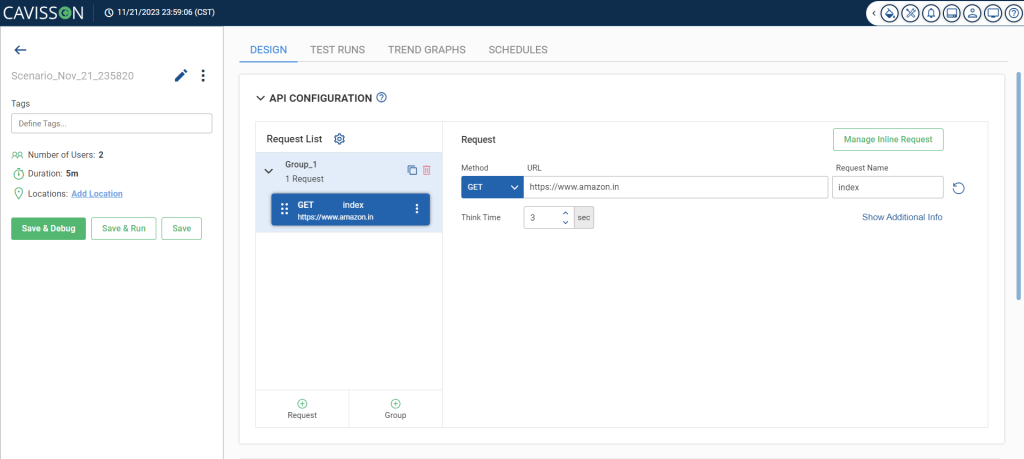
Using the Scenario Configuration Wizard, you can perform API testing by adding and configuring the required APIs or by importing APIs directly from your Postman collection.
Contact us today to embark on your API testing journey to make your business-critical applications fail-proof and significantly enhance user experience.