Site Reliability Engineering
Site Reliability Engineering (SRE)
Modern days web applications need constant behold and improvements even when it’s serving less traffic. This also includes monitoring performance, reviewing anatomy, balancing application defects.
Earlier these activities were being handled by forefront developers and system administrators but lagged behind or were left with certain gaps. Site Reliability Engineering is a must have to improve the availability, efficiency, capacity planning, and monitoring.

Why SRE over DevOps
DevOps is more about streamlining development operations for building a robust product. Whereas, SRE is a practice of creating and maintaining a highly resilient service. DevOps primarily focuses more on the automation, SREs focus on stability and scalability of production environment, as well as observability.
What is SRE
SRE allows software engineers to own the daily ongoing operations of the application in the production environment. It deals with practices like real-time monitoring of applications or services and alerting to enhance productivity and development practices to automate and improve the system’s health and availability.
SRE unites development and functioning, by combining software engineering and systems to raise a very highly productive system. It is a practice of creating, maintaining a highly resilient service and focus on stability of production environment, observability, and scale reliability.
Key SRE Capabilities
| Monitoring and reviewing application performance stats. | Enabling diagnostics for key performance issues | Log indexing and Pattern analytics | Isolating defects and feature requests |
SRE Attributes
SLI
Service Level Indication (Informs health of a service.)
SLO
Service Level Objective (Keep track of SLI.)
SLA
Service Level Agreement (Type of business agreement.)
Error Budget
An error budget states the numeric expectations of SLA availability.
SRE (SLI/ SLO) Monitoring using Cavisson Monitoring Suite
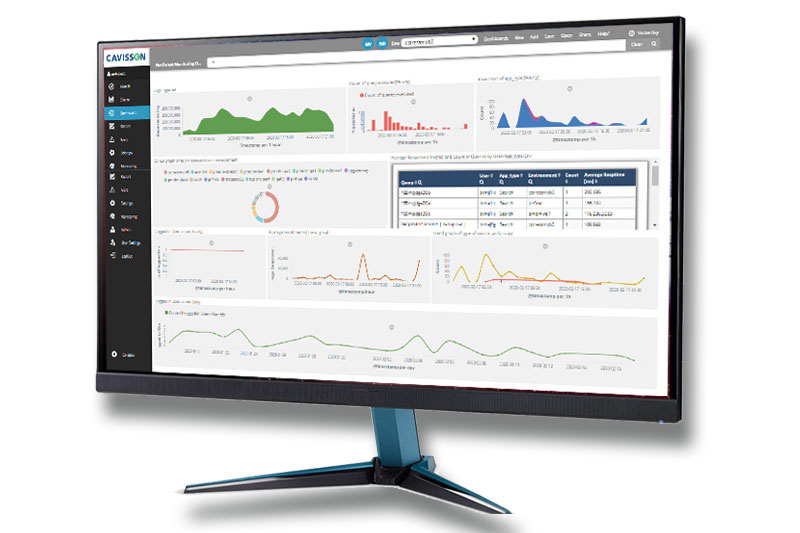
Insights into application performance with SLO focused metrics within an interactive dashboard.
- CPS / CPM, Errors for each services
- Error, Latency, throughput stats along with time taken by integration point calls
- Insight into infrastructure health with Disk, system load stats to identify potential issues
- Drill down to individual requests for detailed insight and RCA
- Synthetic monitoring to check real time availability of applications

SLO driven real-time alerts
- Trigger alerts with manual or dynamics threshold for different severity states
- Drill down from alerts for detailed insight and RCA
- Configure alerts across different metrics along with percentile/ rate and custom metrics
- Geo map and Health dashboard allows to track uptime and system/ application health
- Identify patterns and trends in behavior, and correlate to assess the ongoing viability of SLOs
- Business performance monitoring using business KPI Dashboard (Order/ Revenue/ cart)
Key metrics to focus
| Health and Performance metrics | SLO violation duration graph | Session Duration | Business Transaction Response Time/Load | Error Rate | Batch Latency | Throughput | Counts of cache hits | Database Response Time | Real-time performance |

