The Industry Speaks: Survey Insights on Comprehensive Observability
Q1: Which combination of observability tools provides the most actionable insights during performance testing?- UX Monitoring + APM
- APM + Log Analysis
- Log Analysis + UX Monitoring
- All three integrated together (80% voted for this)
Day 2 Poll
Q2: What is your biggest challenge in correlating data across observability tools?- Inconsistent timestamps and data formats (30% voted for this)
- Lack of common identifiers (40% voted for this)
- Tool integration limitations (30% voted for this)
- Analysis of complexity and skills gap
Day 3 Poll
Q3: How do you use insights from performance testing to improve your observability strategy?- Identify new metrics to monitor (100% voted for this)
- Adjust alerting thresholds
- Create custom dashboards for critical paths
- Refine log collection and analysis
The Business Case for Integrated Observability
Release Quality and Velocity
Organizations that integrate comprehensive observability with performance testing consistently report higher release quality and faster deployment cycles. When performance testing is enhanced with integrated UX monitoring, APM, and log analysis, teams experience:- Significantly faster root cause identification during performance testing cycles, with integrated observability providing complete visibility from user impact to system-level bottlenecks
- Substantial reduction in post-release incidents through comprehensive pre-production validation that combines load testing with real-time observability insights
- Dramatically improved mean time to resolution (MTTR) when issues do occur, as performance testing data correlates directly with production observability metrics
- Higher deployment frequency with maintained stability, as integrated observability during performance testing builds confidence in release quality
User Satisfaction and Business Impact
The synergy between integrated observability and performance testing creates measurable business value that extends far beyond technical metrics: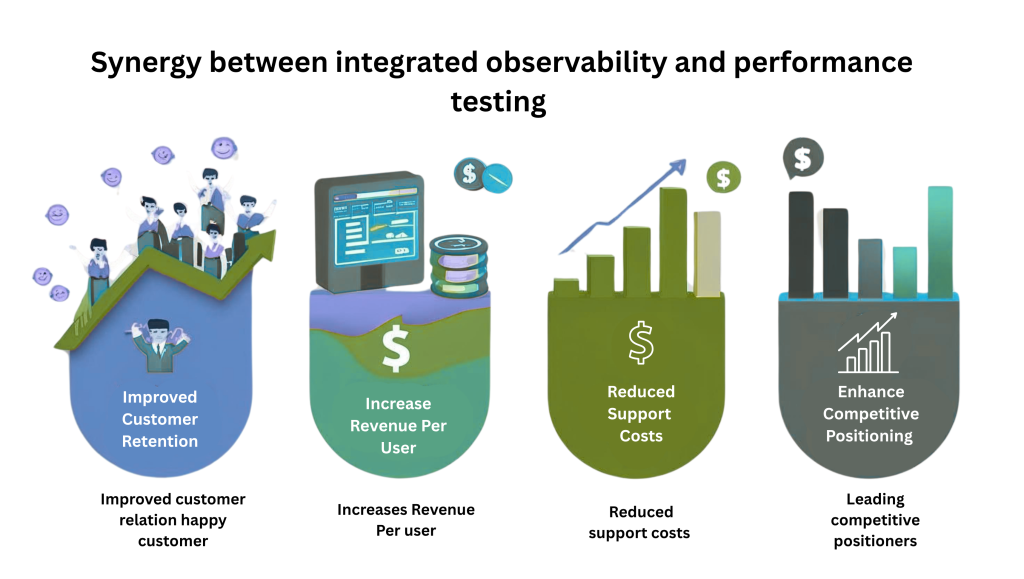
- Improved customer retention when performance testing is guided by comprehensive observability ensures applications meet user expectations under real-world conditions
- Increased revenue per user when performance optimization is driven by integrated insights from load testing, user experience monitoring, and application performance data
- Reduced support costs when performance testing, combined with observability, catch and resolve issues before they reach production users
- Enhanced competitive positioning through the ability to deliver consistently superior application performance, validated through comprehensive testing and monitoring integration
Framework for Connected Monitoring During Performance Tests
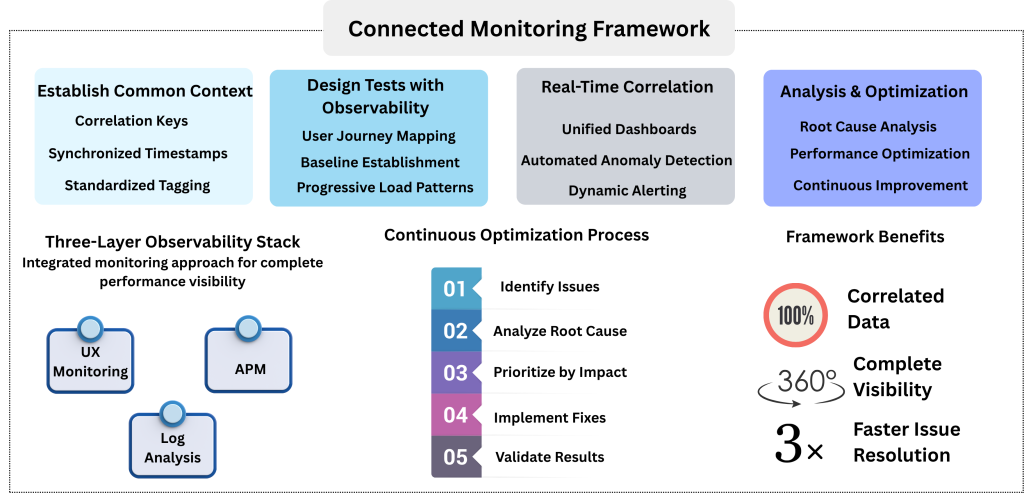
Establish Common Context
Before running performance tests, create a unified context that spans all observability tools:
Correlation Keys: Implement unique identifiers that flow through your entire application stack. These might include:
- User session IDs
- Transaction correlation IDs
- Request trace IDs
- Business transaction identifiers
Synchronized Timestamps: Ensure all tools use consistent time synchronization (NTP) and time zones to enable accurate correlation.
Standardized Tagging: Apply consistent metadata tags across UX monitoring, APM, and logs to enable cross-tool filtering and analysis.
2. Design Performance Tests with Observability in Mind
User Journey Mapping: Structure performance tests around realistic user journeys that can be traced across all three observability layers:
- UX monitoring tracks user interactions and perceived performance
- APM follows application-level transaction flows
- Log analysis captures detailed execution context and errors
Baseline Establishment: Before load testing, capture baseline metrics across all observability tools to understand normal operating parameters.
Progressive Load Patterns: Design tests that gradually increase load while monitoring how each observability layer responds, revealing performance degradation patterns.
3. Real-Time Correlation During Testing
Unified Dashboards: Create dashboards that combine metrics from UX monitoring, APM, and logs in a single view, enabling immediate correlation of performance patterns.
Automated Anomaly Detection: Implement cross-tool anomaly detection that can identify when performance degradation in one layer (e.g., increased database response time in APM) correlates with user experience issues (e.g., increased page load times in UX monitoring).
Dynamic Alerting: Configure alerts that trigger based on conditions across multiple observability tools, providing early warning of complex performance issues.
4. Post-Test Analysis and Optimization
Root Cause Analysis: Use integrated observability data to trace performance issues from user impact back to root causes:
- Start with UX monitoring to identify affected user journeys
- Use APM to pinpoint application bottlenecks
- Leverage log analysis to understand the detailed execution context
Performance Optimization: Prioritize optimization efforts based on business impact:
- Focus on user journeys with the highest business value
- Address bottlenecks that affect the most users
- Optimize based on actual user behavior patterns
Why Integrated Observability Transforms Performance Testing
Let’s break down the power of observability + testing convergence:
Observability Layer | Role in Performance Testing | Benefit |
UX Monitoring (NetVision) | Captures real user behavior during load | Reveals real-time impact on digital experience |
APM (NetDiagnostics Enterprise) | Tracks application health, backend calls, and bottlenecks | Pinpoints degraded services or failing transactions |
Log Monitoring (NetForest) | Deep diagnostic for errors, exceptions, and anomalies | Enables root cause analysis across infrastructure |
Performance Testing (NetStorm) | Simulates load to test app limits | Unveils failure points before users ever see them |
When these tools work in concert, your teams can:
- Detect issues faster.
- Correlate symptoms with root causes.
- Reduce mean time to resolution (MTTR).
- Validate UX at scale, not just server metrics.
Cavisson’s Unified Experience Management Platform
Cavisson Systems addresses the challenges of integrated observability through a purpose-built Unified Experience Management Platform that seamlessly connects performance testing with comprehensive monitoring. Unlike fragmented multi-vendor solutions, Cavisson provides a single platform where all observability and performance testing tools work together natively.
NetStorm + NDE + NV + NF: Complete Integration on One Platform
NetStorm Performance Testing serves as the foundation, generating realistic load patterns that stress-test applications while providing detailed performance metrics that automatically correlate with all other platform components.
NDE (Application Performance Monitoring) monitors application-level performance, tracking transaction flows, database queries, and system resources with microsecond precision, sharing real-time data with performance testing and user experience monitoring.
NV (User Experience Monitoring) captures real user interactions, measuring page load times, user satisfaction scores, and business transaction completion rates, providing unified insights during both testing and production phases.
NF (Log Analysis) provides comprehensive log collection and analysis, correlating events across distributed systems and enabling deep troubleshooting with automatic integration to performance test results and APM data.
The Power of a Unified Platform Experience
The Cavisson Experience Management Platform eliminates the integration challenges that plague multi-vendor observability stacks. All tools share the same data model, correlation keys, and user interface, enabling teams to seamlessly move from performance testing to production monitoring to troubleshooting within a single platform experience.
Unified Platform Benefits
Single Platform Experience: All observability and performance testing capabilities exist within one unified interface, eliminating the need to switch between multiple tools and dashboards during critical analysis phases.
Native Data Integration: Unlike third-party integrations that require complex configuration and often lose data fidelity, all Cavisson tools share a common data model with built-in correlation keys and synchronized timestamps.
Seamless Workflow Integration: Teams can execute performance tests, analyze APM data, review user experience metrics, and investigate logs within the same platform, dramatically reducing analysis time and improving collaboration.
Unified Machine Intelligence: Advanced analytics and machine learning algorithms work across all data sources on the platform, automatically identifying performance bottlenecks, predicting issues, and correlating their business impact across the entire application lifecycle.
Consistent User Experience: Teams only need to learn one platform interface and workflow, reducing training time and increasing productivity across performance testing, monitoring, and troubleshooting activities.
The Future of Performance Testing and Observability
As applications become more complex and user expectations continue to rise, the integration of performance testing and comprehensive observability will become table stakes for successful digital organizations. The survey results clearly indicate that industry leaders already recognize this reality—80% understand that comprehensive observability requires all three monitoring disciplines working together.
Organizations that embrace this integrated approach will gain significant competitive advantages:
- Faster time to market through more efficient performance validation
- Higher application quality through comprehensive pre-production testing
- Better user experiences through proactive performance optimization
- Lower operational costs through reduced incidents and faster resolution
The question isn’t whether to integrate observability with performance testing—it’s how quickly you can implement a comprehensive approach that delivers business value.
Conclusion
The transformation from siloed performance testing and monitoring to integrated observability represents a fundamental shift in how organizations approach application performance. Survey data confirms what performance engineers have long suspected: comprehensive visibility across UX monitoring, APM, and log analysis provides dramatically better insights than any single tool or partial combination.
Success requires more than just tool integration—it demands a fundamental rethinking of performance testing processes, organizational workflows, and success metrics. Organizations that invest in this transformation will be better positioned to deliver exceptional user experiences while maintaining operational efficiency.
The future belongs to organizations that can see their applications holistically, understanding how every component contributes to user experience and business outcomes. With the right integrated observability approach, performance testing becomes not just a validation step but a strategic advantage that drives continuous improvement and competitive differentiation.
Ready to transform your performance testing with comprehensive observability? Contact Cavisson Systems to learn how our integrated NetStorm + NDE + NV + NF platform can provide the visibility your organization needs to deliver exceptional digital experiences.