From Gherkin Files to Functional & Performance Tests in Minutes
Stop rewriting what your QA team already wrote. Cavisson’s intelligent import engine transforms Gherkin feature files into production-ready functional and performance tests — assertions included, zero rework required.
The Problem & The Solution
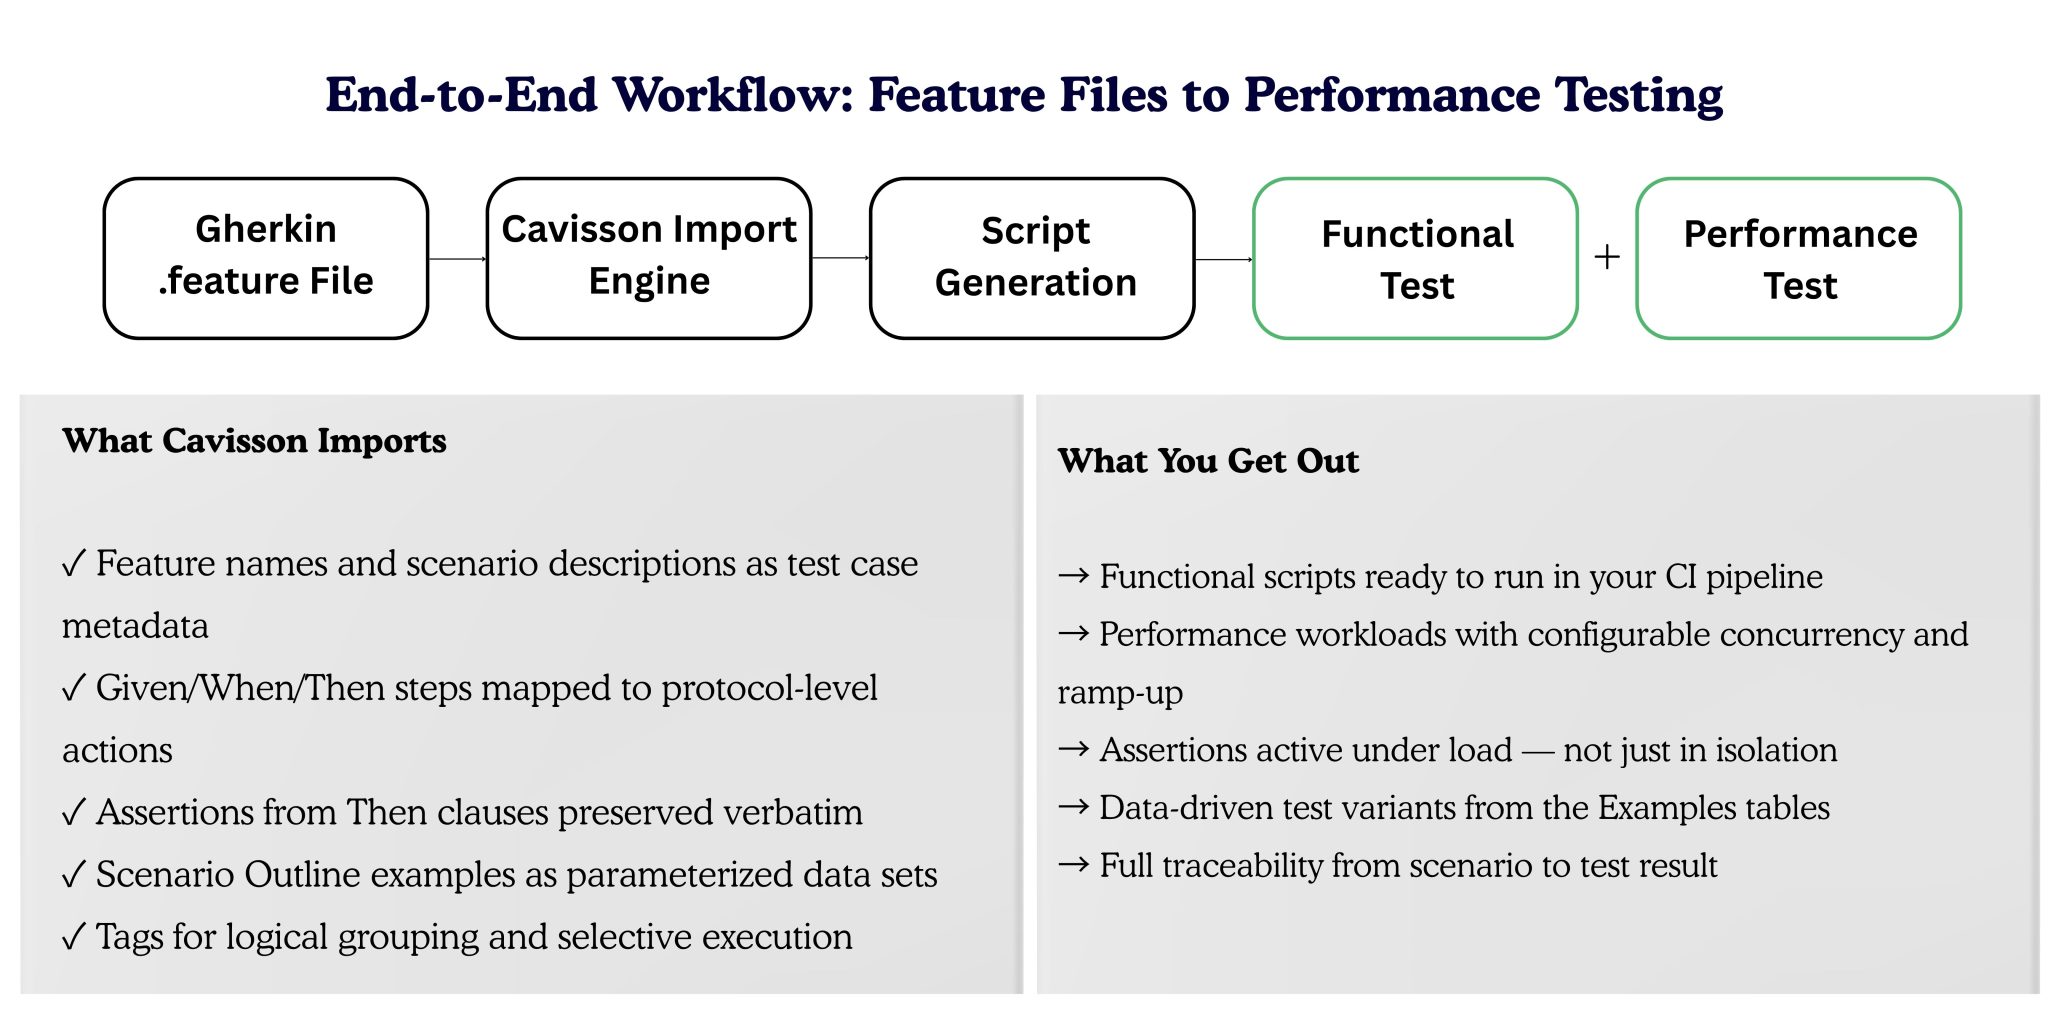
Every modern QA team maintains a library of Gherkin feature files — carefully crafted BDD scenarios that define precisely how an application should behave. These files represent enormous intellectual investment. Yet when it comes to performance testing, engineering teams typically start from scratch, duplicating intent, duplicating effort, and inevitably introducing drift between functional and performance test coverage.
Cavisson eliminates this duplication entirely. The platform ingests your existing Gherkin .feature files directly and produces test scripts that run as both functional validation suites and high-concurrency performance workloads — from the very same source of truth.
Observability & Analytics
Analysis That Actually Finds the Root Cause
Knowing a test failed is not the same as knowing why it failed. Cavisson combines test execution data with deep observability — correlating transaction traces, infrastructure metrics, application logs, and business KPIs in a single timeline — so your team can go from alert to root cause in minutes, not hours.
MTTD
Mean Time to Detect reduced by correlating test failures with system metrics in real time
MTTR
Reduced by enabling faster root cause analysis through real-time insights.
100%
Achieve complete visibility by correlating test failures with system metrics in real time.
Distributed Tracing
Every test transaction is traced end-to-end across microservices. Latency spikes are attributed to specific spans — database queries, downstream calls, or internal processing — with no manual correlation needed.
Infrastructure Correlation
CPU saturation, memory pressure, disk I/O, and network throughput are overlaid on the test timeline. A slowdown at minute 4 of a load test is instantly tied to a CPU spike on a specific node.
Anomaly Detection
Baseline-aware alerting flags deviations from historical performance profiles. Seasonal patterns and deployment-induced regressions are distinguished automatically.
Business Impact View
Test results are surfaced alongside business metrics — conversion rate, error budget burn, and revenue-impacting transactions — so engineers and product teams speak the same language.
For API tests, Cavisson surfaces the specific endpoint, database query, or third-party call responsible for an SLA breach. For web application tests, it pinpoints render-blocking resources, JavaScript errors, and Core Web Vitals regressions — all within the same dashboard.
Enterprise Integrations
Failures Flow Directly into Your Dev Workflow
A test failure that requires manual triage and ticket creation is a delay your business can’t afford. Cavisson’s integration layer automates the entire escalation lifecycle — from detection to assignment — ensuring issues are acted on immediately with full context.
Automatically create bugs with observability context
When test cases fail, Cavisson instantly generates bug reports enriched with deep observability data. Instead of raw failure signals, developers receive actionable insights — including traces, logs, infrastructure metrics, and root cause indicators — enabling faster debugging without additional investigation.
Proactive incident creation tied to business impact
Cavisson continuously monitors key performance indicators (KPIs) such as latency, error rates, and throughput. When these KPIs degrade beyond defined thresholds, incidents are automatically created and routed to the appropriate team based on service ownership, severity, and impact.
Intelligent auto-assignment and routing
Using service mappings and dependency intelligence, incidents and bugs are assigned to the right teams from the start — eliminating triage overhead and reducing response time.
Closed-loop resolution validation
Once a fix is deployed, Cavisson can automatically re-run impacted scenarios to validate resolution, ensuring issues are not just addressed but verified — closing the feedback loop without manual effort.

Conclusion
Your QA team’s Gherkin files aren’t just documentation. In the hands of Cavisson, they become the foundation of a fully automated, observability-powered testing operation — covering both functional validation and production-scale performance from a single source of truth. The impact is immediate and compounding. Weeks of script creation shrink into minutes. Functional and performance testing stay perfectly aligned as your application evolves. And when failures occur, root cause insights are automatically surfaced and routed to the teams that can fix them — without delays or manual effort.
Massively Reduce Time to Test.
Stop duplicating effort across functional and performance teams. Import your Gherkin files, configure your load profile, and let Cavisson handle everything from execution to insight to resolution.