In today’s digital ecosystem, applications are judged not only by their functionality but by how they feel to end users. Page responsiveness, rendering behavior, browser interactions, and visual stability are now core to user experience—and therefore central to performance testing. Traditional load testing tools simulate protocol-level traffic, but they fall short when it comes to capturing how a real browser renders each page, loads each resource, and visually responds to every interaction.
Cavisson’s Real Browser User (RBU) Testing bridges this gap by combining the power of real browser interaction recording with the scalability of performance testing. It enables teams to record true user actions from an actual browser, replay them under load, analyze deep performance metrics, and visually inspect exactly how the application behaved during the test.
Capturing Real User Interactions Through Browser Recording
RBU testing begins with recording actions on a live browser—clicks, form submissions, navigation steps, dynamic components, and asynchronous behavior. Instead of relying on protocols, Cavisson captures what the user actually sees and does.
This ensures that the script represents authentic user journeys, including real DOM load times, JavaScript execution behavior, CSS layout delays, third-party resource impact, and the rendering time of images, fonts, and dynamic components. By working at the browser level, Cavisson delivers a true representation of end-user performance.
Replaying Interactions at Scale With Load Testing
Once recorded, the RBU script can be executed just like any performance test scenario. Cavisson allows organizations to run these scripts across multiple virtual users, combining real browser load with the power of Cavisson’s distributed testing engine.
This approach is ideal for validating page speed under peak loads, UI rendering behavior across sessions, JavaScript-heavy or SPA application performance, real-world behavior of third-party scripts, and the overall customer experience during high load. Instead of only knowing how fast the server responded, teams can now see how fast the page actually rendered.
Deep Page Analytics With Page Average Reports
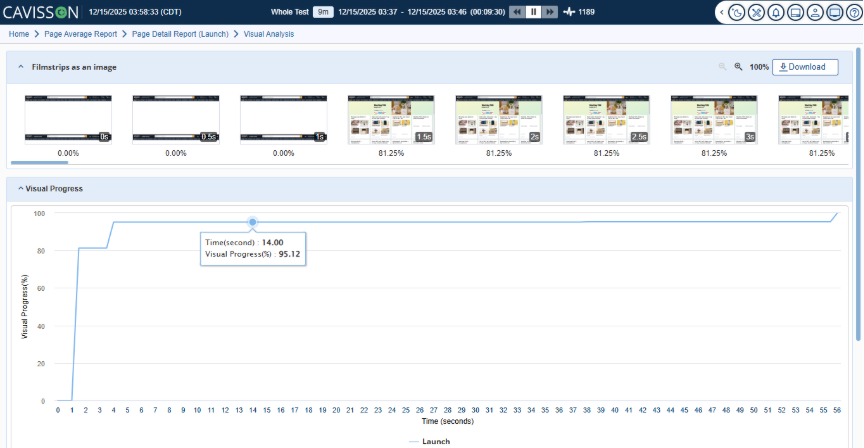
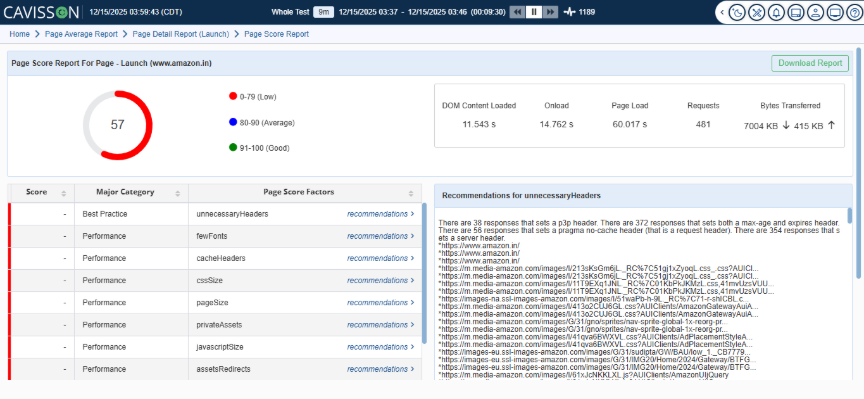
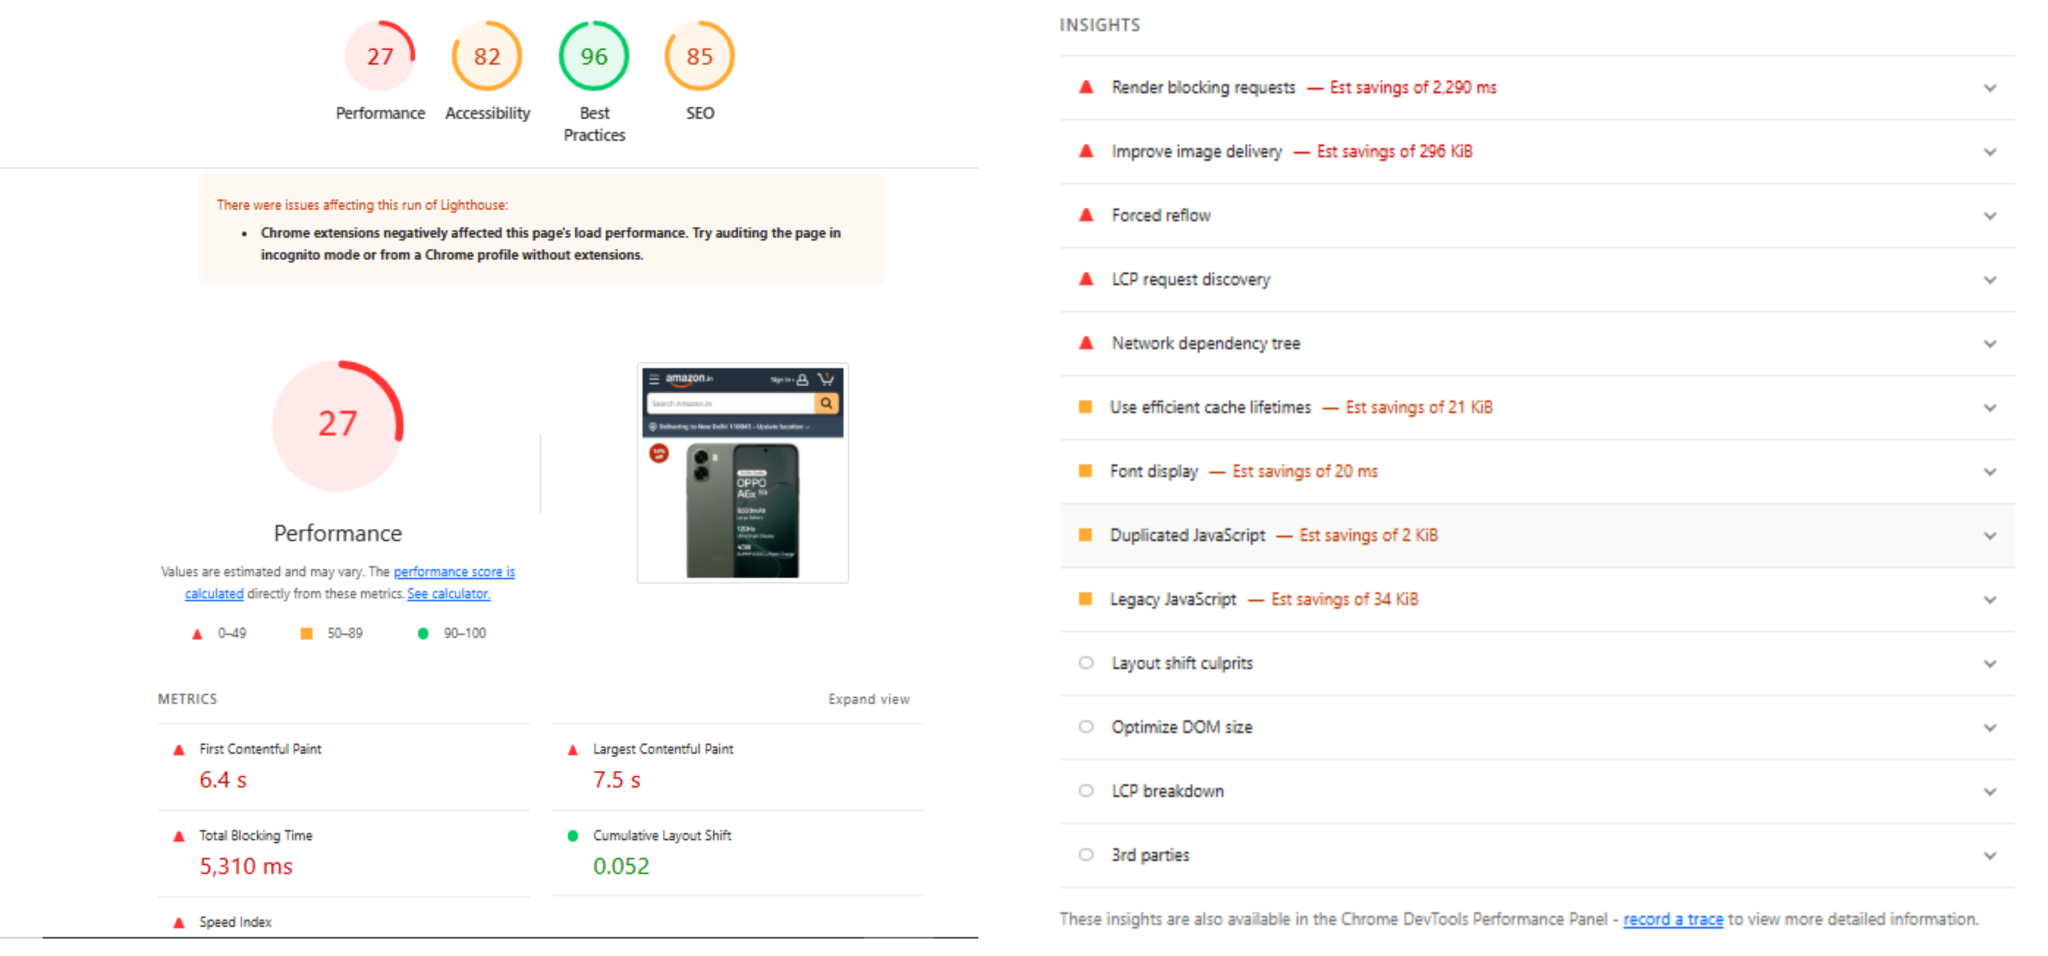
After the load test completes, Cavisson generates detailed page-level analytics that highlight how the browser performed. The Page Average Report becomes the central hub for understanding rendering behavior and user experience metrics.
Teams can evaluate average page load time, first paint and first contentful paint, DOM content load, resource-level timing, and response behavior across different sessions. This high-level performance view helps teams quickly identify UI bottlenecks, rendering delays, and slow resources.
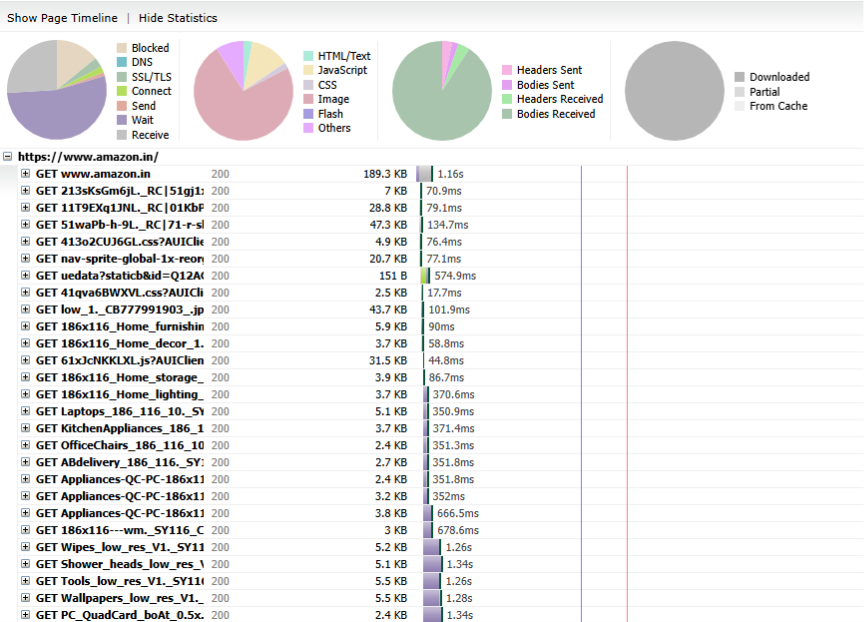
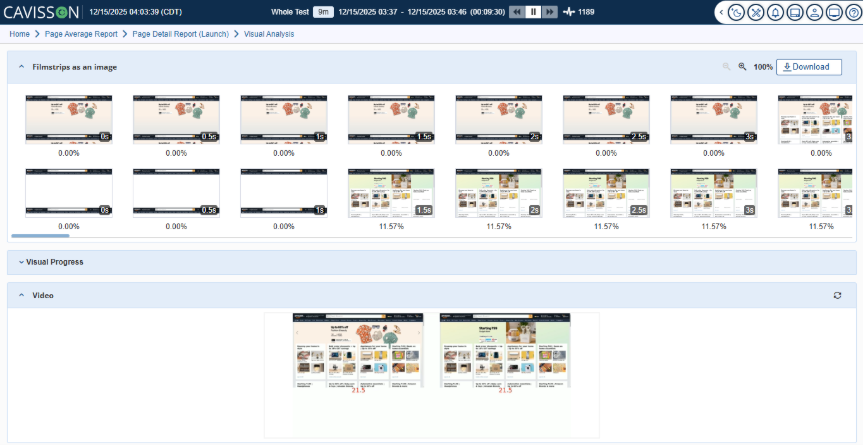
Waterfall Analysis for Every Page Load