Black Friday 2025 is projected to generate over $75 billion in online sales. But here’s the sobering reality: for every second your website is slow or unavailable, you’re not just losing transactions—you’re hemorrhaging revenue, customer trust, and competitive advantage.
The Million-Dollar Stakes of Black Friday
The numbers tell a brutal story. During peak shopping periods:
- 1 second of downtime can cost large retailers up to $300,000, according to a Gartner study on IT downtime costs.
- 53% of mobile users abandon sites that take longer than 3 seconds to load, as reported by Google Research on mobile site performance.
- A single performance incident during Black Friday can wipe out an entire quarter’s worth of customer acquisition efforts, according to Forrester Research.
When your infrastructure buckles under 10x normal traffic, the consequences extend far beyond immediate lost sales. Customer lifetime value evaporates. Brand reputation takes years to rebuild. And your competitors? They’re capturing the customers you worked all year to attract.
Why Point Tools Fail When It Matters Most
Most organizations approach Black Friday with a patchwork of disconnected tools:
- Testing teams rely on platforms like LoadRunner or k6 to simulate user load and validate scalability. But these tools operate in isolation, offering no visibility into how that load impacts downstream systems or real users in production.
- DevOps teams monitor infrastructure through solutions such as AppDynamics, Datadog, or Dynatrace. While powerful for system metrics, they often lack direct correlation to user experience or business KPIs.
- Application teams dig through log analysis tools like Splunk, Elastic APM, or New Relic to trace issues post-incident. However, the process is manual, time-consuming, and reactive rather than proactive.
- Business stakeholders may now have dashboards and reports, but they still struggle to interpret the complete context—how application performance, infrastructure stability, and user experience converge to affect revenue in real time.
This fragmentation creates dangerous blind spots. When a checkout failure surfaces at 2 AM on Black Friday, your teams waste precious minutes:
- Correlating data across multiple dashboards
- Debating whether it’s a frontend issue, API bottleneck, or database constraint
- Manually stitching together incomplete pictures of user impact
- Escalating through siloed teams while revenue bleeds
The result? Mean Time to Resolution (MTTR) stretches from minutes to hours. By the time you’ve identified and fixed the issue, thousands of abandoned carts have already cost you millions.
The Unified Platform Advantage: Performance Meets Profit
The shift from point tools to unified experience management isn’t just operational efficiency—it’s business resilience. Here’s what changes when you consolidate testing, monitoring, service virtualization, and AI-driven insights into a single platform:
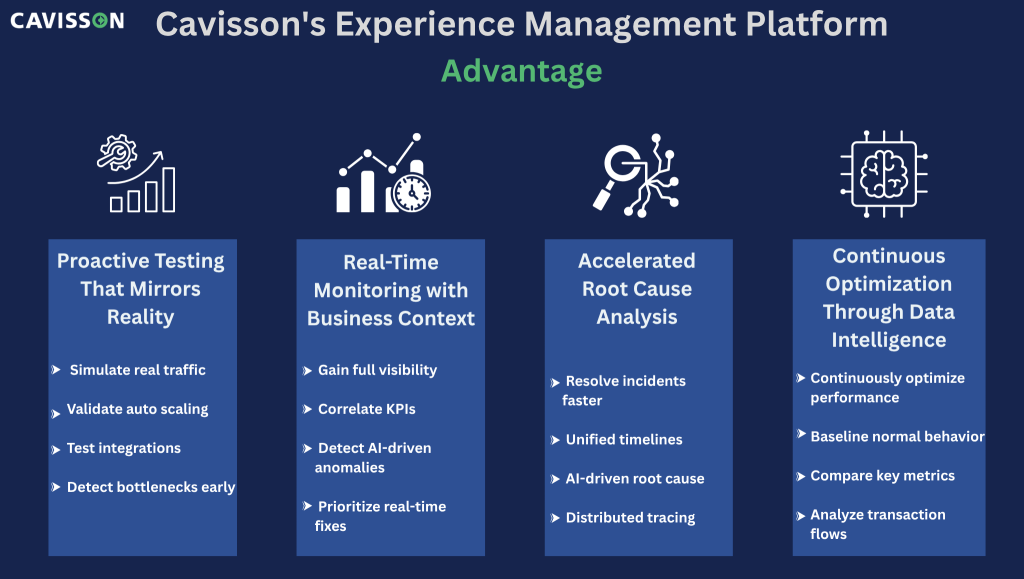
1. Proactive Testing That Mirrors Reality
Pre-Black Friday load testing isn’t about hoping for the best. With the performance testing module of Cavisson’s Experience Management Platform, you can:
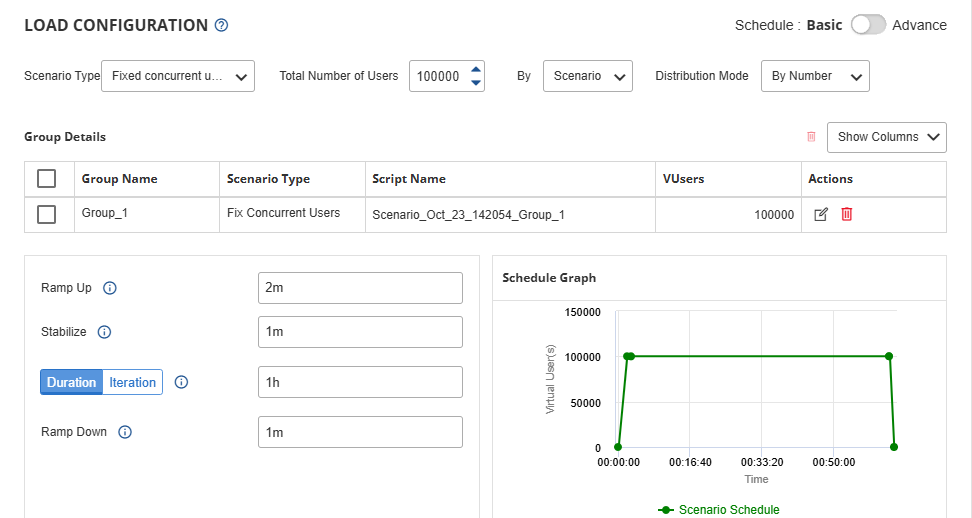
- Simulate millions of concurrent users across complex transaction flows
- Test third-party payment gateway integrations without depending on vendor availability (via service virtualization)
- Identify breaking points in your infrastructure before customers do
- Validate that your auto-scaling policies actually work under real-world conditions
2. Real-Time Monitoring with Business Context
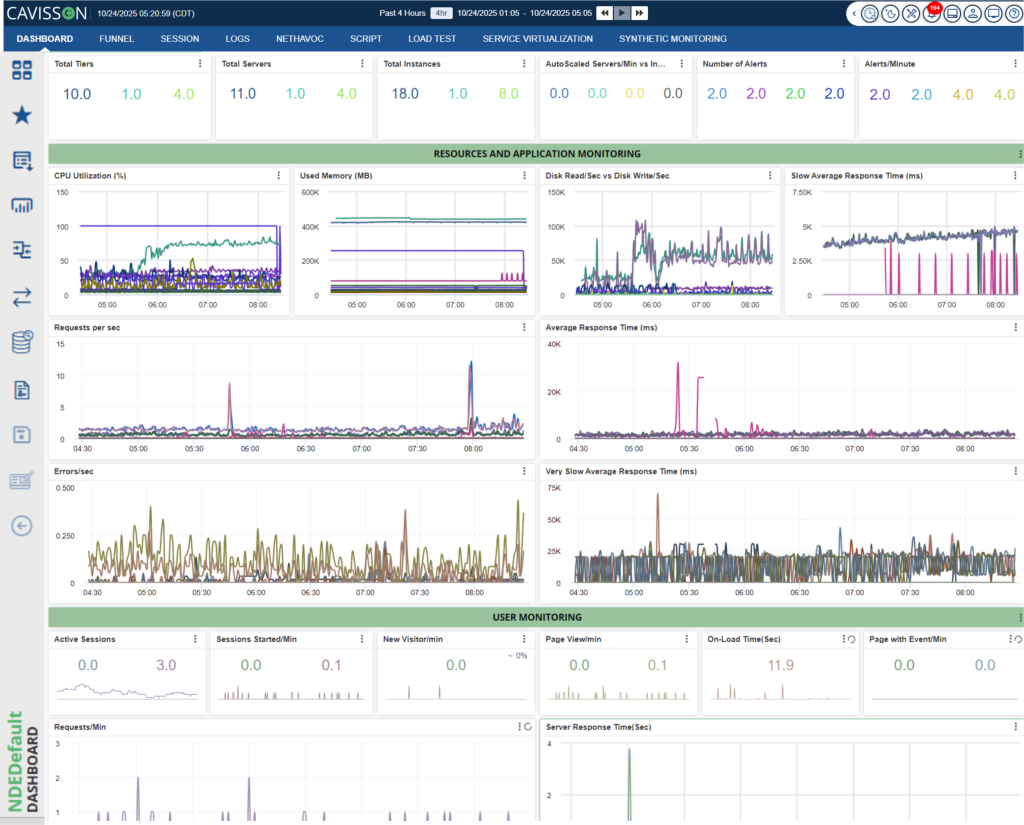
When traffic surges, you don’t need more metrics—you need intelligent insights. An experience management platform provides:
- End-to-end transaction visibility: From browser click to database query, see exactly where slowdowns occur
- Business KPI correlation: Instantly understand how a 500ms API delay impacts conversion rates
- Automatic anomaly detection: AI identifies unusual patterns before they cascade into outages
- User experience scoring: Know which customer segments are affected and prioritize fixes accordingly
3. Accelerated Root Cause Analysis
The power of unification becomes clearest during incidents. Instead of jumping between tools:
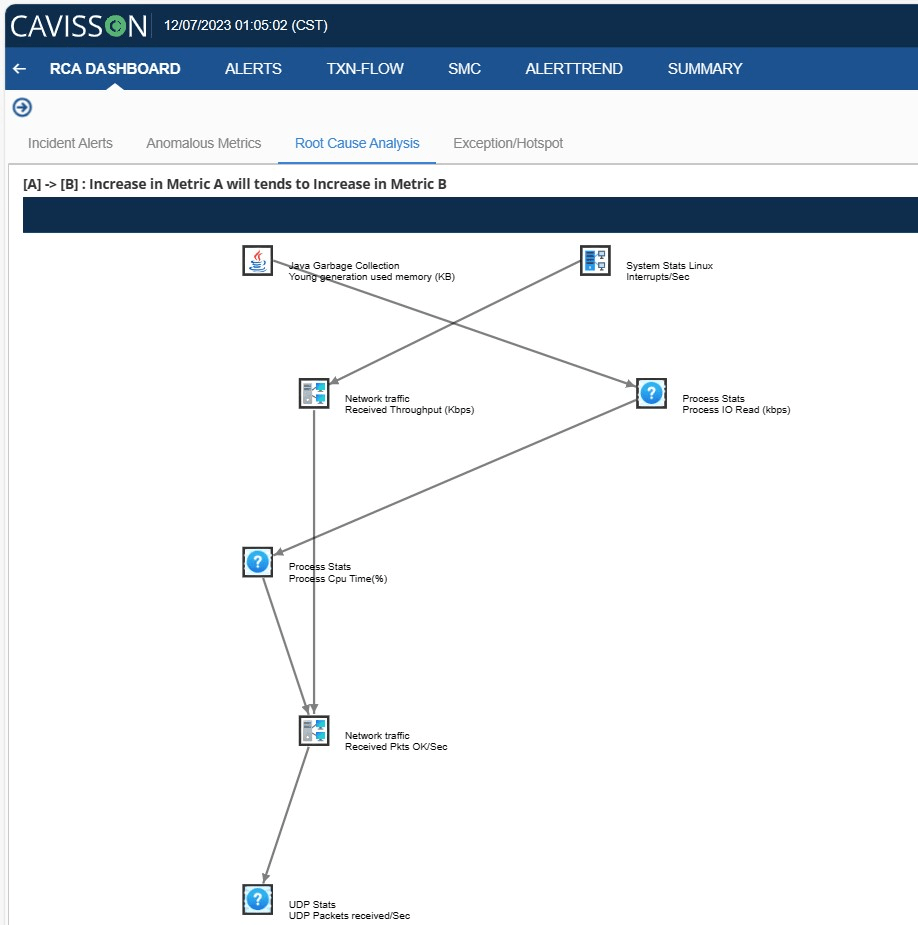
- A single timeline correlates load test results, production metrics, and deployment events
- Distributed tracing automatically maps requests across microservices
- AI-powered diagnostics suggest probable causes based on historical patterns
- One dashboard gives every stakeholder—from developers to executives—the visibility they need
4. Continuous Optimization Through Data Intelligence
Beyond firefighting, unified platforms enable continuous performance improvement:
- Baseline normal behavior to detect degradation early
- Compare pre-production test results with live production metrics
- Identify optimization opportunities through transaction flow analysis
- Build a knowledge base of performance patterns that improve year over year
Real-World Impact: From Chaos to Control
Consider a major retail client who partnered with Cavisson before last year’s Black Friday. Previously reliant on disconnected monitoring and reactive firefighting, they faced a critical decision: continue with the status quo risk or transform their approach.
The Challenge:
- Checkout completion rates dropped to 62% during the previous peak events
- Average MTTR for performance incidents: 47 minutes
- No clear visibility into third-party service impacts
- Testing cycles took weeks due to dependency constraints
The Unified Approach: Using Cavisson’s integrated platform, they implemented:
- Comprehensive load testing with service virtualization for all payment gateways
- Real-time monitoring across 200+ microservices
- AI-driven alerting with automatic root cause suggestions
- Single-pane visibility for cross-functional war rooms
The Results:
- MTTR reduced to 8 minutes: Unified visibility eliminated diagnostic guesswork
- Checkout rates improved to 94%: Proactive testing identified and resolved bottlenecks pre-launch
- Zero revenue-impacting outages: During the highest traffic event in company history
- 73% reduction in escalations: Issues resolved before customers noticed
More importantly, their performance team transitioned from reactive crisis management to proactive optimization, continuously improving conversion rates throughout the holiday season.
Get Performance-Ready Before Peak Traffic Hits
Black Friday success isn’t determined on the day itself—it’s won in the weeks of preparation that precede it. The question isn’t whether you can afford to invest in unified experience management. It’s whether you can afford not to.
As traffic projections climb and customer expectations intensify, the gap between resilient businesses and vulnerable ones widens. Organizations that embrace end-to-end visibility, AI-driven insights, and proactive testing position themselves not just to survive peak season but to dominate it.
Don’t wait for downtime to expose your blind spots.
Cavisson’s unified platform combines enterprise-grade load testing, real-time application monitoring, service virtualization, and AI-powered analytics—giving you complete visibility and control over digital experiences when it matters most.
Ready to turn Black Friday from a risk into an opportunity?
Click for schedule your performance readiness assessment
Let’s ensure your infrastructure is as ambitious as your revenue targets.